Take a closer look at how trend line functions and how many successful traders utilize it?
The skill to draw a line on the chart is ability traders should have. However, how to draw trend lines and other lines differ depending on the traders as they can be subjective to the wish or intention of each trader.
This article introduces the overview of the trend line, including why it works and how many traders utilize it.
Contents of this article:
・How to draw a trend line
・Why does a trend line emphasize “shadow”?
・Why is a trend line helpful?
・How to use a trend line to catch the sign of trend reversal
・How to use a trend line to place a buy entry/sell entry
Contents
How to Draw a Trend Line
First, we take a look at how to draw a trend line.
<Upward Trend Line>
The line connecting the lowest price and the originations of waves which hit a new high.
<Downward Trend Line>
The line connecting the highest price and the originations of waves which hit a new low.
Based on the Dow Theory (*), an uptrend continues as long as the price keeps hitting a new high after the rebound at the level higher than the previous low. An uptrend line can be drawn by connecting these lows. To the contrary, a downtrend continues as long as the price keeps hitting a new low after the reversal at the level lower than the previous high. A downtrend line can be drawn by connecting these highs.
An uptrend line acts as a support line for the upward phase of the market. Meanwhile, a downtrend line acts as a resistance line at the downward phase
(*) The Dow Theory was put forward more than a century ago, but is still popular among many traders. It means that this theory has been useful and effective throughout the ages. For details, please refer to the following site.
【Dow Theory】 Learn The Basics Of FX
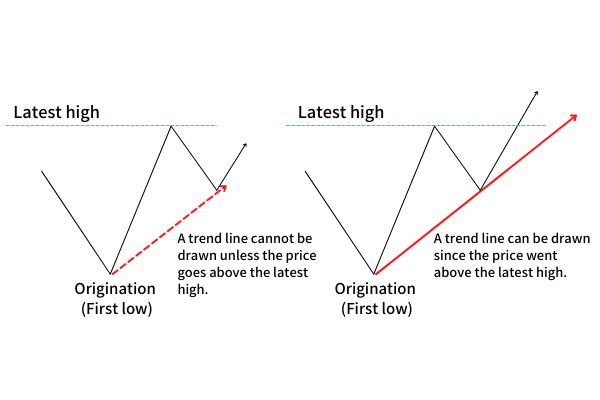
As shown in the above, at least two points are required to draw an uptrend line; the first low and the second low higher than the first. But unless the price goes above the latest high, an uptrend line cannot be drawn.
Once the price goes above the latest high, a trend line can be confirmed which connects the first low and second low. Please make sure that if you connect two or more low prices to draw a line without any careful consideration, it won’t function as an uptrend line.
Drawing a trend line is equal to agreeing to checking the price movement in accordance with the Dow Theory. You should follow the price movement - whether it reverses at the level higher than the previous low or lower than the previous high, or it hits a new high or new low - in order to visualize the occurrence of a trend with a trend line.
Why Does a Trend Line Emphasize “Shadow”?
“Shadow” indicates the highest and/or lowest prices described by a candlestick chart. Many traders tend to draw a trend line connecting two or more tips of shadows. Some use a candlestick chart while others prefer a bar chart. Shadow can be commonly recognized even if they use different kinds of charts. Therefore, it is widely recommended that a trend line should be drawn by connecting tips.
However, the price does not always respond to a trend line in an appropriate or orderly fashion. This is because the exchange rate differs between FX brokers and all traders are not always following exactly the same price movement. Therefore, you don’t have to take the above recommendation into consideration seriously.
In addition, its margin of error caused by the difference of brokers is so insubstantial. In fact, a trend line can offer its utility because traders all over the world virtually refer to the same chart to do the transactions. The details of its utility will be mentioned later.
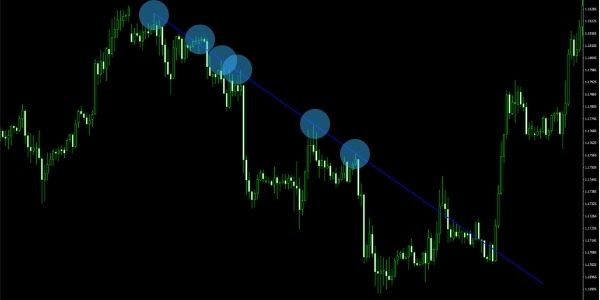
The following chart is an hourly candlestick chart of EUR/USD. As you can see, a downtrend line can be drawn by connecting highs. But while the price went down when the shadow touched the line, it was not reversed after briefly crossing the line.
Chart
Tradeview: Innovative Liquidity Connector (ILC Account) MT4
Why Is Trend Line Helpful?
Why is it helpful to use an actual chart to do a technical analysis including a trend line? This is because traders all over the world simultaneously check the same price action.
In the forex market, the price moves in accordance with an upward or downward trend, or between a certain range, or sideways. As proved by the Dow Theory, a certain trend tends to last until a clear sign of reversal appears. It clearly represents the psychology of market players.
To determine the continuation or reversal of a trend, you should look at whether the price goes above or beneath a neck line. When it goes above the line, an uptrend is about to end, and a downward trend is about to end on the contrary. Details will be explained in the next section.
In the forex market, an occurrence of a certain trend and its reversal repeatedly occur. Many players are thinking about how long the current trend lasts and when it is reversed. As more and more players depend on the same chart, wishing to increase profits and prevent losses, the price movement reflects their common intentions of entry, loss-cut and profit-taking. It gives a chart a sort of regularity recognizable through trend lines and horizontal lines.
In fact, traders who have noticed such a regularity definitely succeed in the forex market.
How to Use Trend Line to Catch the Sign of Trend Reversal
Finally, we take a look at how to use a trend line in practice.
First, a trend line should not be used to determine whether the current trend line will continue to be reliable and, based on it, make an entry. Rather, it should be used to determine to ride on the trend after the reversal and make an entry. And you will be more likely to succeed. This is because the market tends to take thousands of transactions when the reversal occurs.
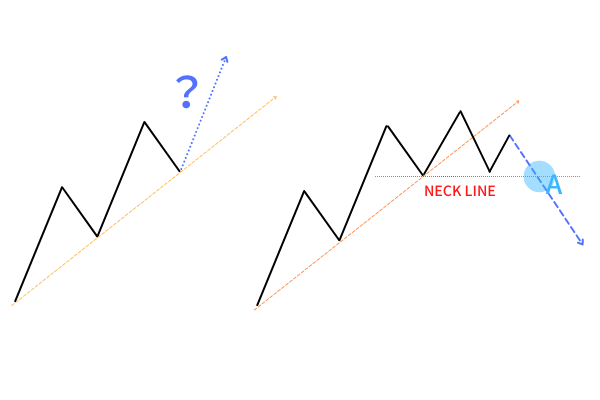
FX trading is a game that a trader should align with other market players to place an order. If you place a buy order when others do the same, you will ride on the anticipated price movement.
Therefore, it is crucial to understand when thousands of orders converge. That is, it is the moment when many loss-cut orders for long- or short positions converge.
Let’s move to the next section to take a closer look.
How to Use a Trend Line in the Actual Trade
When Considering a Buy Entry
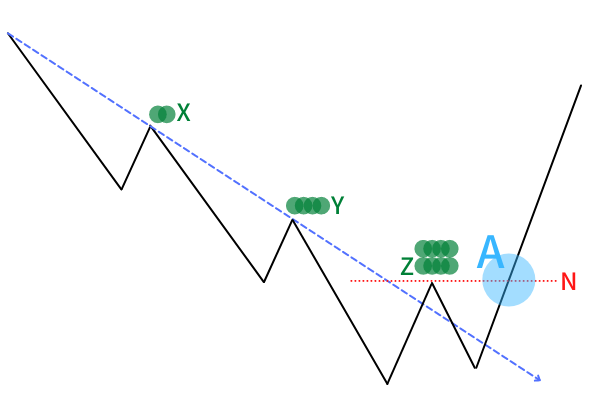
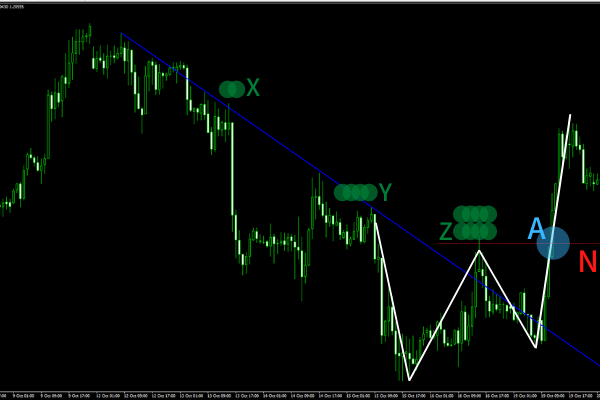
N:Neckline
The horizontal line drawn at the origination where the downtrend market failed to hit fresh low for the first time.
X, Y and Z: Settlement points of traders who had formed the downtrend.
As a downtrend continues, settlements, or profit-taking orders, made by traders tend to converge at these points. And the volume, which is shown with green circles, tends to increase as the point moves from X, Y to X.
A: Entry Point
- Short-position traders formed a downtrend line.
- These traders made transactions. As time passed and transaction points moved from X, Y to Z, the volume increased.
- When the downtrend weakened, the market rebounded without hitting a fresh low and broke through the downtrend line and then the neck line.
- Short-position traders who placed sell orders at the point of Z started to take profits, or made loss-cuts equivalent to the influx of buy orders. At the same time, the entry of long-position traders boosted the rate.
- In anticipation of 4, traders repeated the entry at the level of A.
(*)A loss-cut and a profit-taking settlements by sell entry is equivalent to a buy order. So it matches the settlement direction of a new buy order.
You can confirm the above situation with the following actual chart.
Chart
Tradeview: Innovative Liquidity Connector (ILC Account) MT4
When Considering a Sell Entry
You should determine the conclusion of the uptrend and ride on two kinds of short orders; loss-cut orders made by traders who had created the uptrend and new sell orders made by traders who anticipate the occurrence of a fresh downtrend.
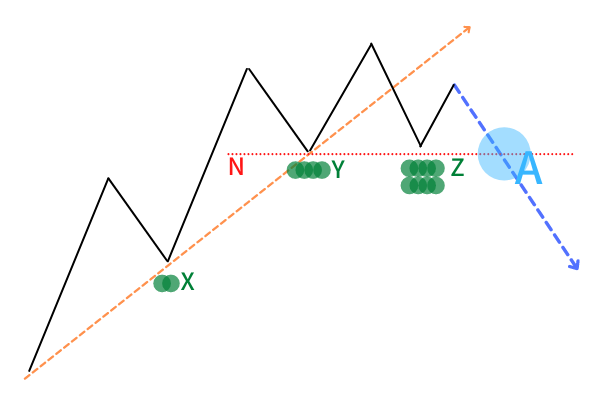
You can make an interpretation opposite to the previous case when considering a sell entry.
Forex market is, in general, mixed with many buy orders and sell orders. But at the moment when either trend ceases, an opposite trend orders increase and accordingly a fresh trend emerges. Since the moment is likely to indicate that a fresh big trend follows, it gives many traders benefits.
Conclusion
Any trend eventually comes to an end. And it is unexpectedly short-lived. You may have a disadvantage if you do transactions expecting that the market will rebound again at the level of trend line. At a moment when a trend fully becomes recognizable for everyone, brilliant traders who started to hold their positions at the start of this trend have already moved to take profits. And the conclusion of the trend follows.
If you want to ride on a certain trend, it is important to enter the market when the previous trend shows a sign of reversal or at the early stage of the targeted trend.
This article introduces how to use a trend line to determine the trend reversal. But what method is used to do so differs between traders. Some use a horizontal line, others rely on a moving average line. So you should find the method suitable to you. The method mentioned in this article is fundamental. I hope everyone who has read this article will succeed in the FX market.
Finally, if you have already read my articles about a horizontal line or how to use a moving average line to determine the timing of entry, you may find that what this article mentions are similar to them. That is right. This is because they have a common ground to establish these logics. Regardless of whether you use a trend line, horizontal line, moving average line or other indicators, it is important to ride on other market players’ profit-taking or loss-cuts in order to steadily succeed.
