This article introduces the moving average (MA), which is widely used by traders for technical analysis. As many traders focus on it, analysing MA will be useful once you learn how to utilize it. I hope you will learn the basics of MA, and I will be happy if it will be helpful to improving your trading performance.
MA represents the price movement by calculating the average price from prices over a certain period of time and connecting those prices. It is calculated from the closing prices on the basis of a certain period (minute, hour, day, etc.). The average line is updated as time passes (one candle for candlesticks). By recognizing the average price for each period, it is possible to understand whether the current price is higher or lower compared to the past price. In addition, since MA is an indicator for many traders, you can use it to determine the best time to buy or sell.
To start with the conclusion, MA provides grounds for trading as it tells us whether the current price is higher or lower than the average price of the given period. In this article, I will first explain the basics of SMA, including how to calculate them.
For more information on how to utilize MA, please refer to "Granville's Law".
There are various kinds of moving averages, such as Simple Moving Average (SMA), Exponential Moving Average (EMA) and Weighted Moving Average (WMA). This article focuses on SMA because it is the most widely-used MA in the world.
Contents
Overview of Moving Average
What is “Moving Average”?
Moving average takes an average of the "closing prices" over a certain period of time. For example, a daily-basis five-period moving average can be calculated by summing the closing prices from day 1 to day 5 and then dividing it by five. This is the same method as calculating an average in other cases. On day 6, the closing price of day 1 should be dropped and the average prices during days 2 through 6 should be calculated. Since the average of closing prices for a certain period is calculated, the range of candles on the chart used for the calculation also changes as a new candle is added. Also, since the calculation range changes with the passage of time, it is called "moving average”.
Some people often call a daily-basis five-period moving average as "five-day moving average”. This in itself is not wrong. However, some YouTuber analysts call “15-minute basis five-period moving average” as “five-day moving average”. This is not correct because that MA is based on a 15-minute chart, not a daily chart. In order to avoid such a misunderstanding, I hereafter refer to moving averages as "X-basis Y-period moving average" or like "15-minute five-period SMA (Simple Moving Average)".
[FYI] If you want to use a 15-minute chart to display a five-day moving average, or a daily-basis five-day SMA, it corresponds to 15-minute 480-period SMA, as 480 periods on a 15-minutes basis is equal to 120 periods on a hourly basis, or five periods on a daily basis.
What is Simple Moving Average (SMA)?
Simple moving average (SMA), the most popular indicator among the moving averages, takes an average of the closing prices over a certain period of time.
How to calculate SMA
We take a look at exactly how to calculate the moving average. Suppose EUR/USD rate has the following prices.
| Day 1 | 1.22000 |
| Day 2 | 1.22500 |
| Day 3 | 1.22600 |
| Day 4 | 1.22700 |
| Day 5 | 1.22800 |
| Day 6 | 1.22900 |
The moving average can be calculated from the fixed prices shown by the candles of the corresponding days. In the case of a daily-basis five-period moving average, the average of the closing prices from day 1 to day 5 is:
(1.22000+1.22500+1.22600+1.22700+1.22800)/5=1.22520
Then, calculate the average of the closing prices from day 2 to day 6:
(11.22500+1.22600+1.22700+1.22800+1.22900)/5=1.22700
Connect 1.22520 and 1.22700 with a line, and it forms a simple moving average (SMA).
There are various thoughts on which time period should be chosen to calculate a moving average. But most traders seem to refer to around 5-20 periods for short term, 20-100 periods for medium term, and 100-350 periods for long term. I am using a daily-basis five-period SMA as an example, but the method of calculation is the same if you choose a 15-minute period or one-hour period.
Market analysis using a moving average (SMA)
Compare the positions of the moving average and the rate.
You can use a candlestick chart to check the price movements of exchange rates. However, it does not show other than it, and it is difficult to grasp the trend from it. Moving averages are based on the movement of candlesticks over a certain period to show the trend during that period.
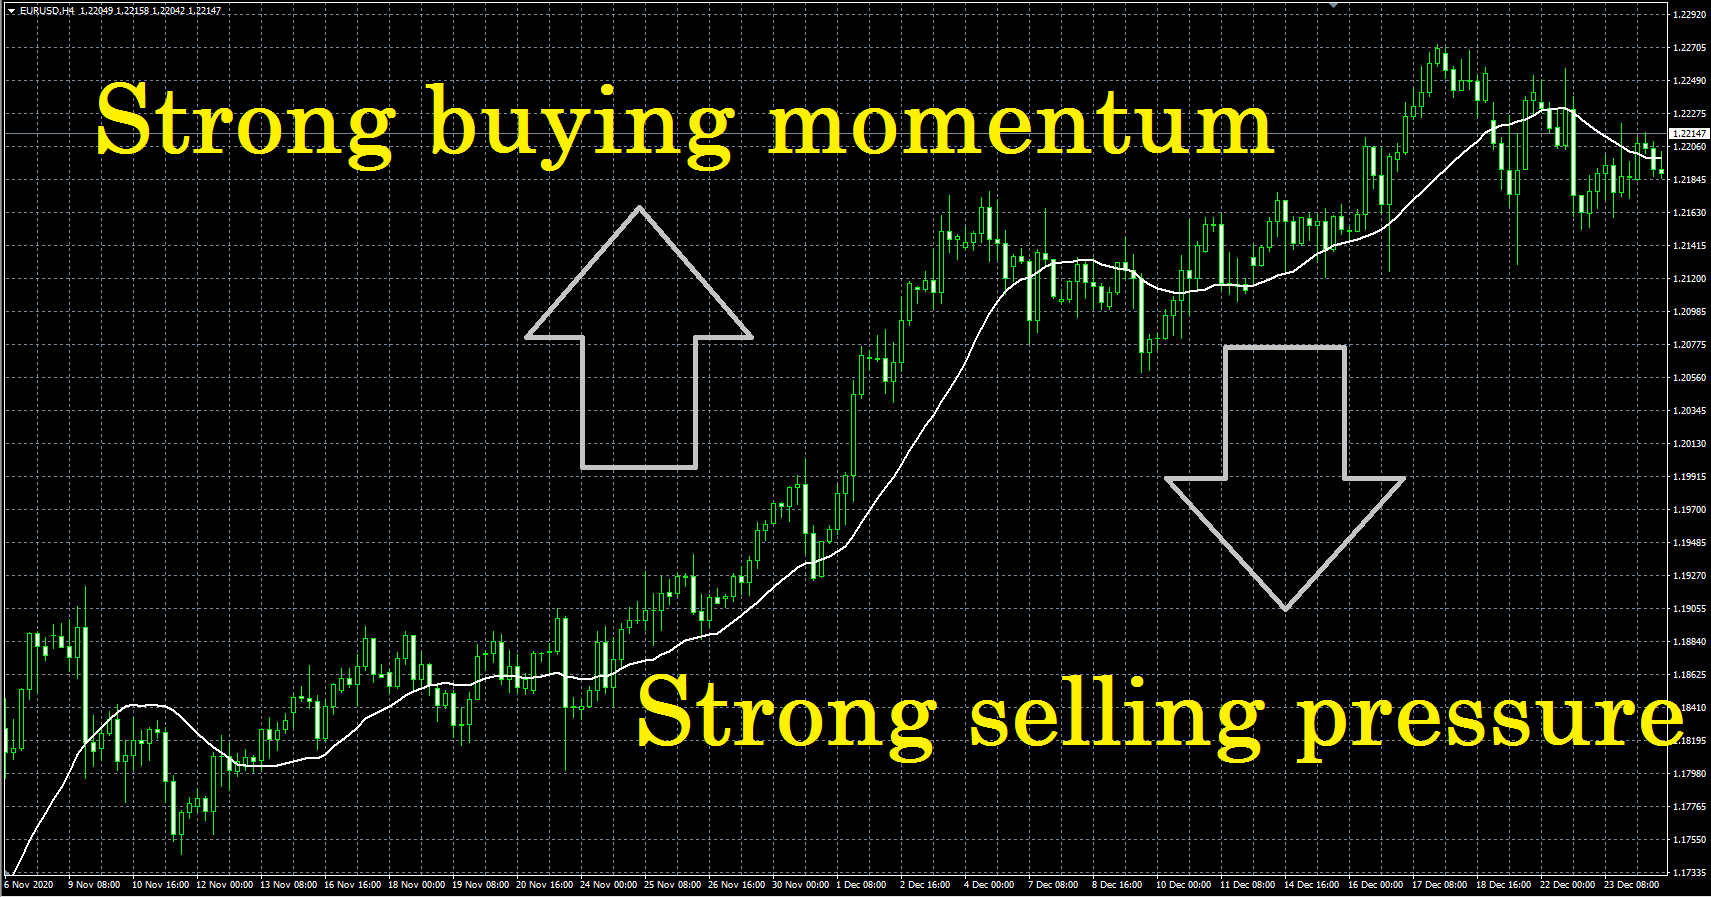
When analyzing the market, it is required to make sure whether the current exchange rate is higher or lower than the moving average. For example, if the current rate is above the daily-basis 25-period SMA, it indicates that the currency has been bought more than the average price of the past 25 days. It means that buying momentum is stronger in the short term. On the other hand, if the rate is below it, it indicates that there is a stronger selling pressure in the short term. The following figure shows the daily chart and 25-period SMA (white line) of the EUR/USD.
Chart
Tradeview: Innovative Liquidity Connector (ILC Account) MT4
Use the moving average to grasp the trend
The moving average represents the recent trend by replacing the latest closing price with the oldest one. Therefore, when the average value goes up, the market is in an upward trend. It is the moving average that allows us to quickly make sure whether the market is in an uptrend or a downtrend, and provides us with a way of looking at trends that we might otherwise lose sight of if we stick to the candle chart.
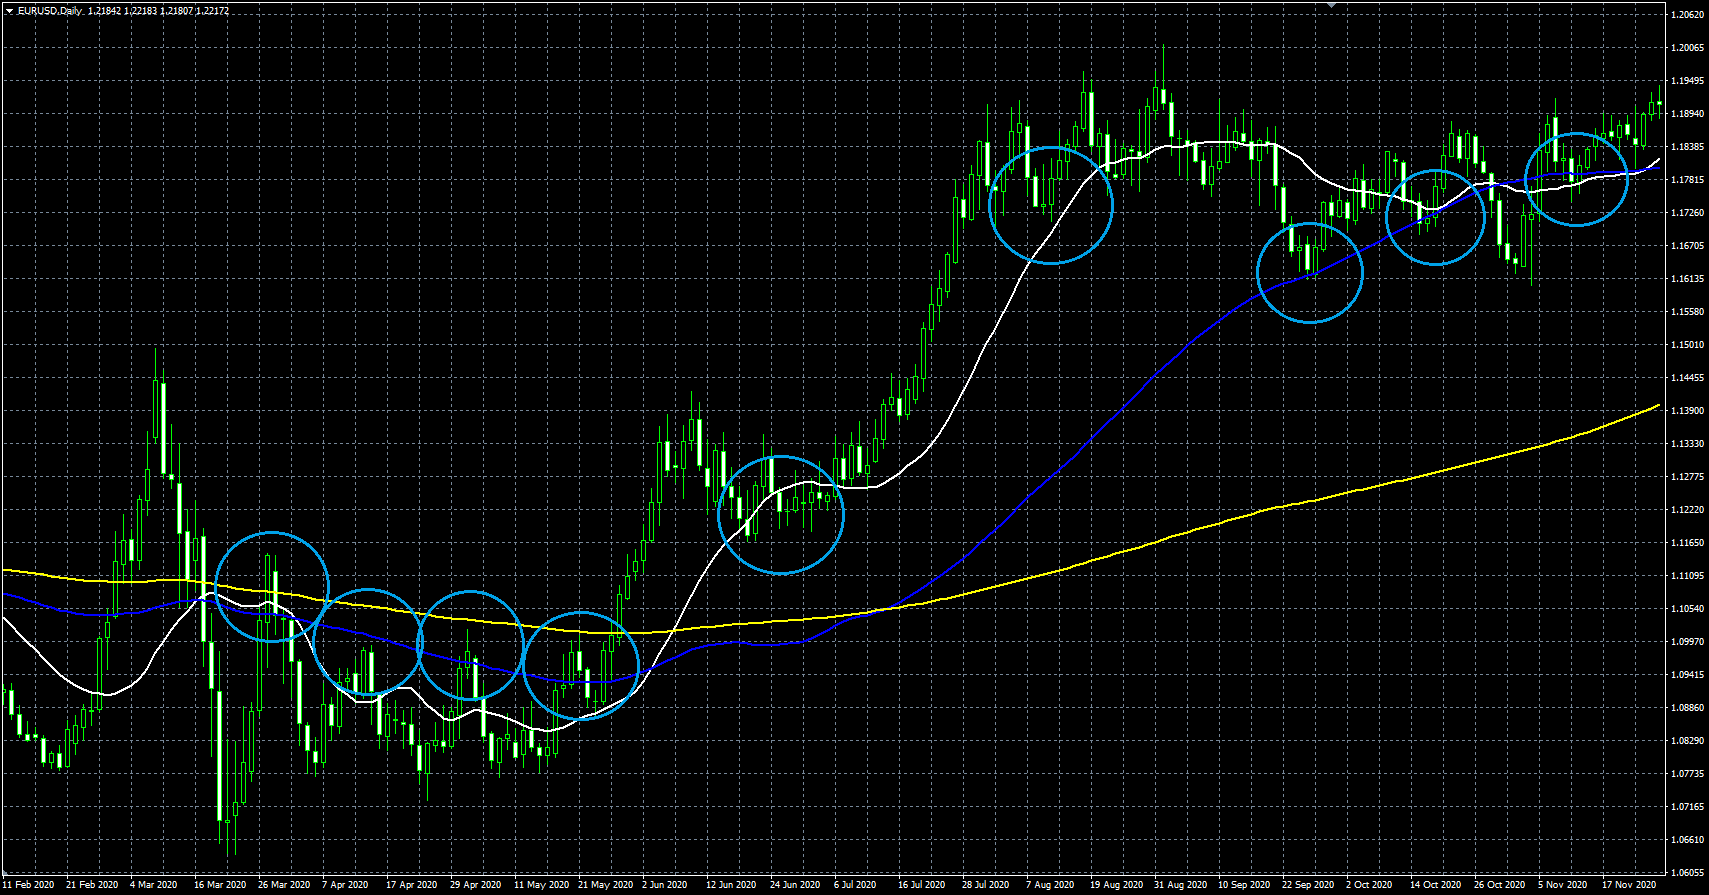
In this explanation, we will use the 25-period SMA to grasp the short-term trend. The 75-period SMA will be used for the medium-term trend, and the 200-period SMA will be used for the long-term trend, respectively. In the following figure, the respective SMAs are overlapped on the daily chart of USD/JPY (25-period: white, 75-period: blue, 200-period: yellow).
Chart
Tradeview: Innovative Liquidity Connector (ILC Account) MT4
If SMA shows downward, it is recognized that the market is in the downtrend, and if it shows upward, it is recognized as an uptrend.
In this example, we can see that the market is at a turning point from downtrend to uptrend in the short and medium terms, and in the long term, from rise-and-fall market to uptrend.
Another feature of SMA is that it plays a role in a resistance line or a support line. If you want to know about the details of this feature, please refer to "Granville's Law".
How to conduct trading using moving averages
Buying on dips and selling on rally
Moving averages mirror the psychology of investors. So they often indicate an important tipping point. For example, when a strong uptrend is continuing, more and more investors want to buy at the lowest price possible. When such psychology prevails, the price is likely to come back to the level of moving average and then rebound. The stronger the momentum of the price movement, the more it reacts to the short-term moving average.
Various textbooks say that "we should enter the market at the point where the rate touches XX-period moving average because the market is likely to rebound there”. However, it is risky to conduct trading on the basis of this idea. Moving averages just represent "average”, while the rate has the tendency of repeatedly deviating from and converging with the average price. Even if the past chart shows that the currency has rebounded at the level of the moving average, there is no guarantee that you will be able to succeed based solely on whether the price touches the average.
The most important feature of moving averages is that they can be used to grasp the trend by their states of incline. And if you want to follow the trend direction and consider the buying on dips in anticipation of uptrend or the selling on rally in anticipation of downtrend, you need to have other factors in addition to the one of whether the rate touches the moving average.
Chart
Tradeview: Innovative Liquidity Connector (ILC Account) MT4
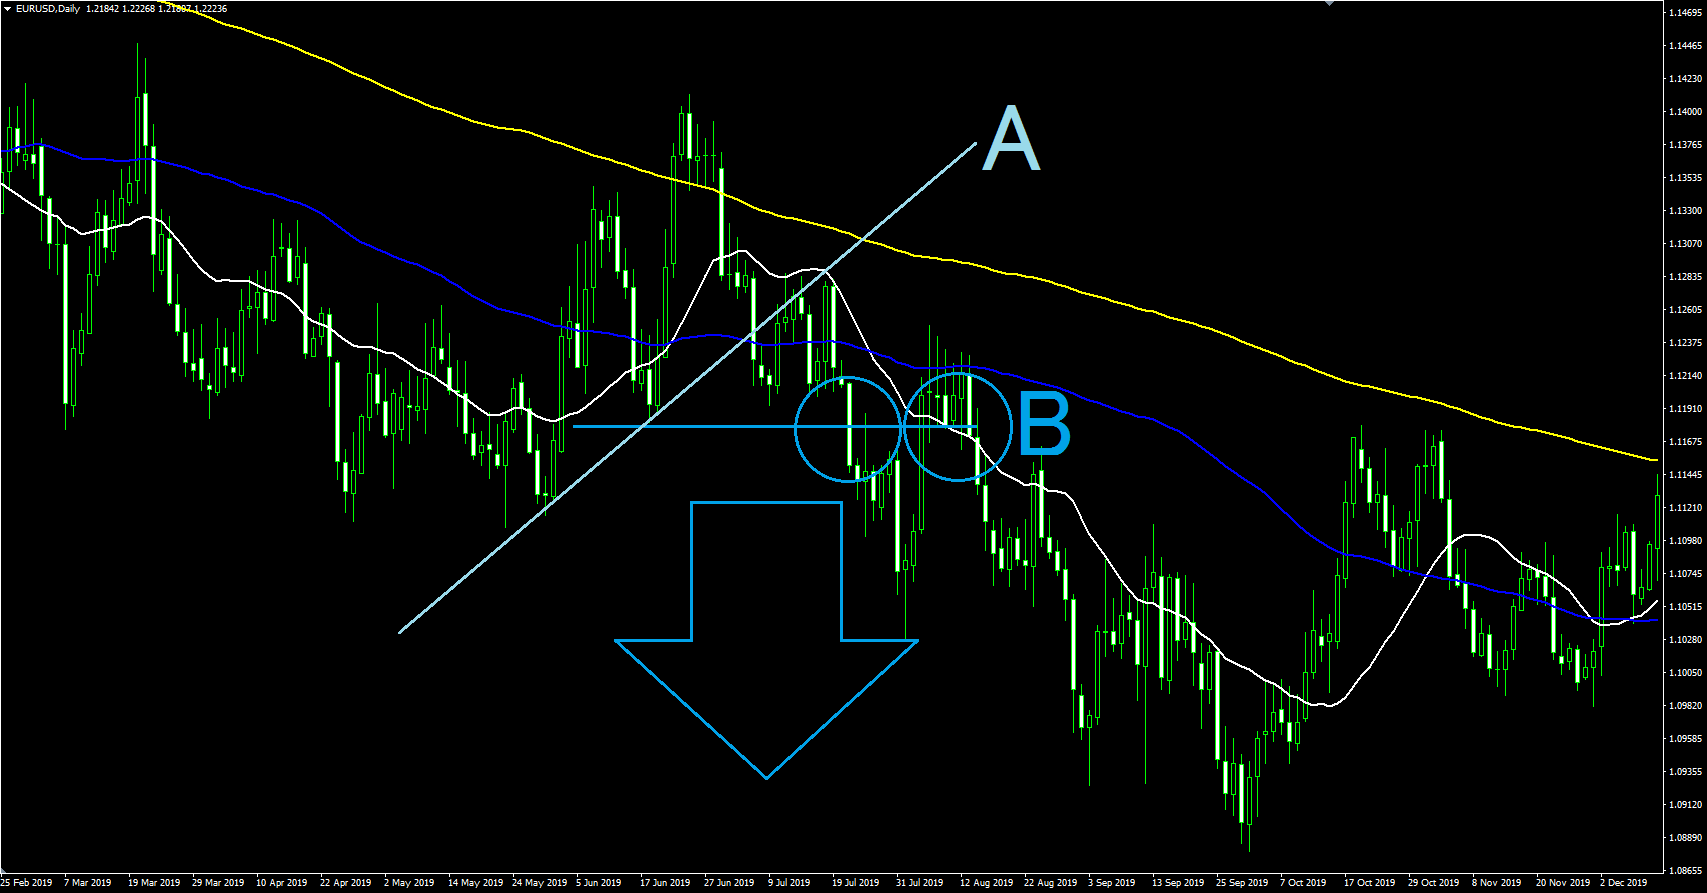
The above figure shows the tipping point where the short-term uptrend A ends and then the downtrend starts. The conclusion of uptrend can be confirmed when the rate falls below B, which is the neckline* of A. If you want to hold a sell position, you should enter the market at the point B. The B line seems to react to short-term and medium-term SMAs, but it also overlaps with the neckline of A. In this way, you can use the moving average to grasp the trend and determine the entry point on the basis of the neckline and other factors.
* Neckline: Indication of the starting point of the wave that failed the attempt to break through the high of the uptrend A. Details of the neckline can be also found in the article "Elliott Wave".
Also, once you get used to looking at moving averages, you will be able to visualize the price movement of the past not shown on the screen by using the states of incline the short, medium, and long term averages show. This will increase the amount of information you can grasp at a glance, so please try to add this skill to your chart analysis.
This concludes the explanation of moving averages.
Thank you for sparing your precious time to read this article.
Utilizing the moving average can help you confirm when to buy in dips and sell on rally.
