A lot of traders pay attention to the indicator called “pivot” as a quite essential tool to do technical analysis and determine the settlement points such as entry, profit taking and loss cut.
<Main Features of Pivot>
・A pivot point can be calculated from the data of previous day, week or month by using a specific calculating formula. So traders all over the world can watch the same pivot.
・A pivot line can be drawn by connecting previous data with current data on the chart, and be extended to the right side of the chart, i.e, future dates, weeks or months.
As traders watch the same pivot line, they emphasize it over other indicators.
This article introduces the summary of the pivot including how to calculate it and how to utilize it for trading.
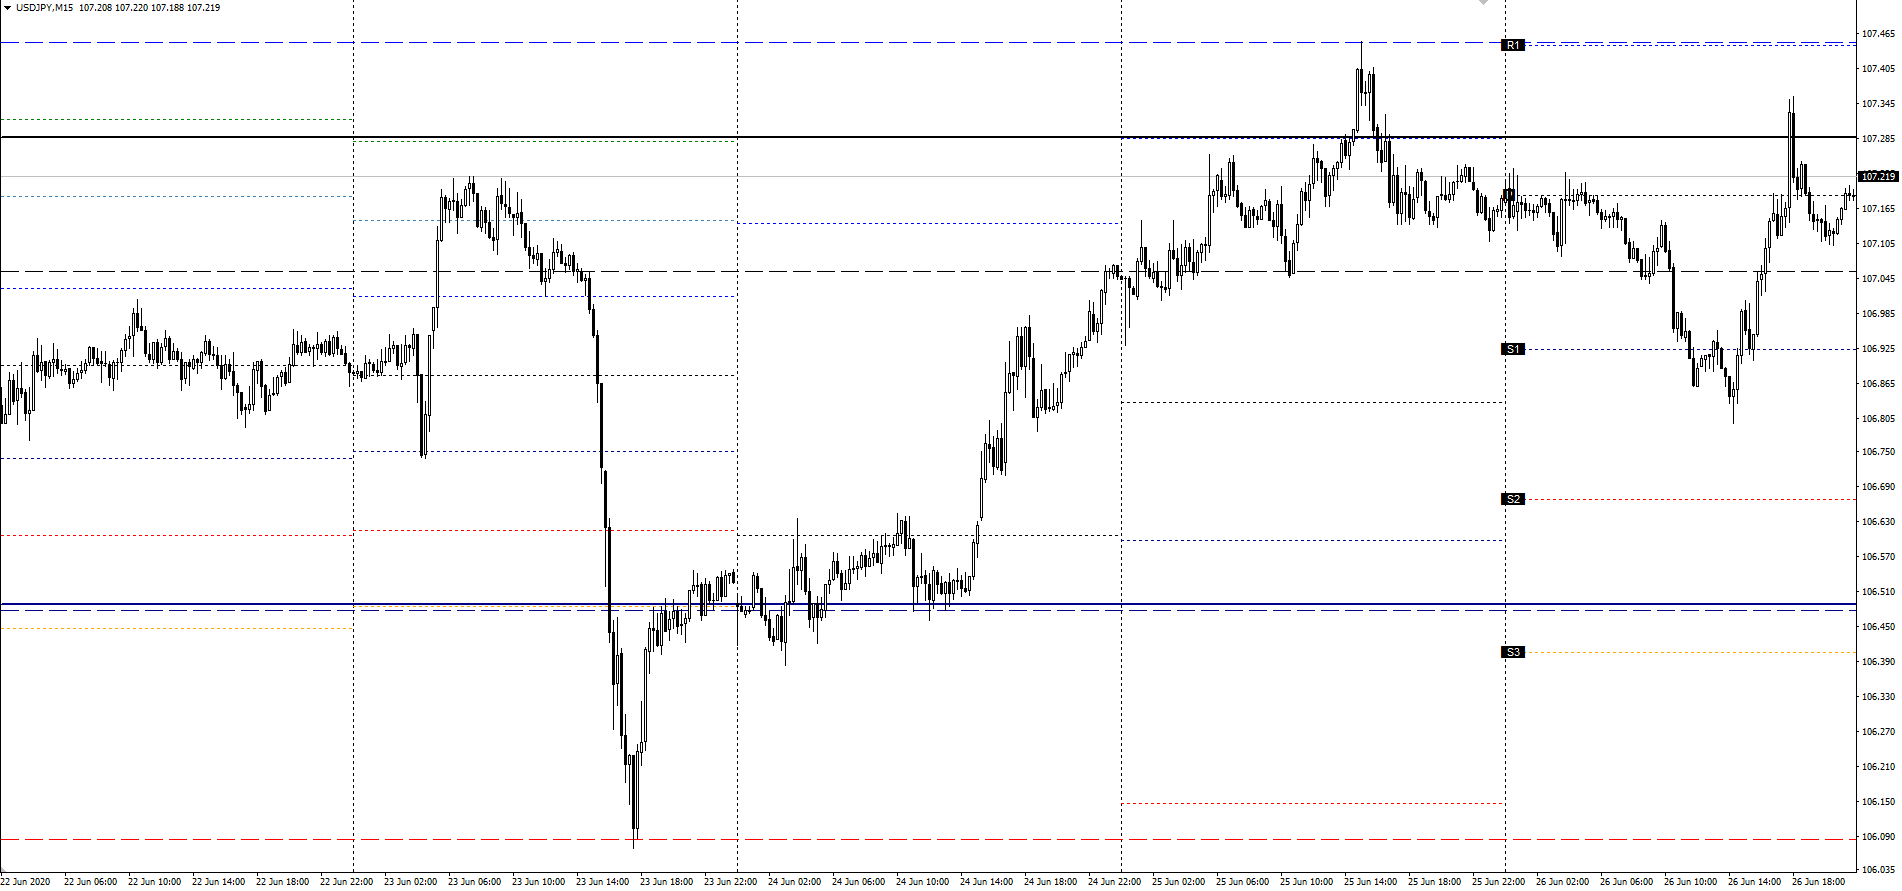
Chart
Tradeview: Innovative Liquidity Connector (ILC Account) MT4
Contents
Developer of Pivot
Developed by: J.Welles Wilder Jr., a technical analyst
Developed indicator: ATR (Average True Range), RSI (Relative Strength Index)
What Is Pivot?
Pivot, which originally means “central point” or “essential point”, has “daily pivot”, “weekly pivot” and “monthly pivot”. Daily pivot is calculated by using high, low and closing prices of the previous day. Likewise, weekly and monthly pivots are calculated from the previous week’s or month’s data respectively. As mentioned below, a pivot point represents the average of high, low and closing prices, and a support line and a resistance line can be drawn above or beneath the pivot point. It is thought that “pivot” is named after its role as a guide center line of support and resistance lines.
Features of Pivot
Features of Pivot ①
Trades all over the world can watch the same pivot as it is calculated from the date of previous day, week or month by using a specific calculating formula. Unlike other indicators like a moving average line, parameters used for drawing a line will not vary between traders. Also, unlike a trend line or horizontal line, discretion of traders will not play a role in calculating a pivot.
Features of Pivot ②
Other indicators can visualize only the past movement. Meanwhile, by drawing a pivot line to connect the data of the previous day, week or month and the current data on the chart, it can be extended to the right side of the chart so that traders can see the possible future price movement.
[NOTE]
As it is calculated from high, low and closing prices, the pivot line can be changed depending on the time zone setting on the chart. If you utilize a pivot for the trading, it is recommended to use “GMT+2.0”, or “GMT+3.0” during the daylight saving time period, to match the closing time of the New York market.
How to Calculate Pivot
Next, we take a look at how to calculate a pivot point. The below shows an example of a daily pivot line (P). A pivot line is accompanied by three resistance lines (R1, R2 and R3) above “pivot point” and three support lines (S1, S2 and S3) below it.
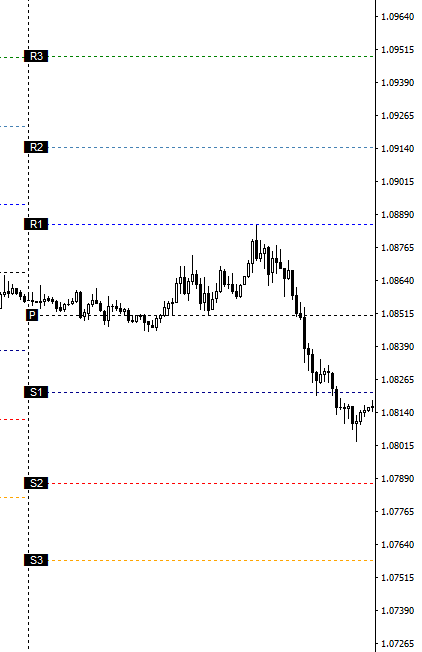
Chart
Tradeview: Innovative Liquidity Connector (ILC Account) MT4
How to Calculate Daily Pivot Point
To calculate the value, use high, low and closing prices of the previous day.
P = (High + Low + Close) / 3
R1 = P × 2 - Previous low
R2 = P + Previous high - Previous low
R3 = P × 2 - Previous low × 2 + Previous high
S1 = P × 2 - Previous high
S2 = P- Previous high + Previous low
S3 = P × 2 - Previous high × 2 + Previous low
As you see the above formulas, resistance and support lines are based on the pivot point of that day (P). Closing price of the previous day is used only to calculate a pivot point, and other indicators are calculated with the previous high and low prices.
If you want to calculate weekly or monthly pivot points, you can apply high, low and closing prices of previous week or month to the above formulas.
How to Utilize Pivot Line for Trading
①Utilize the Price Movement Responsive to Pivot Line
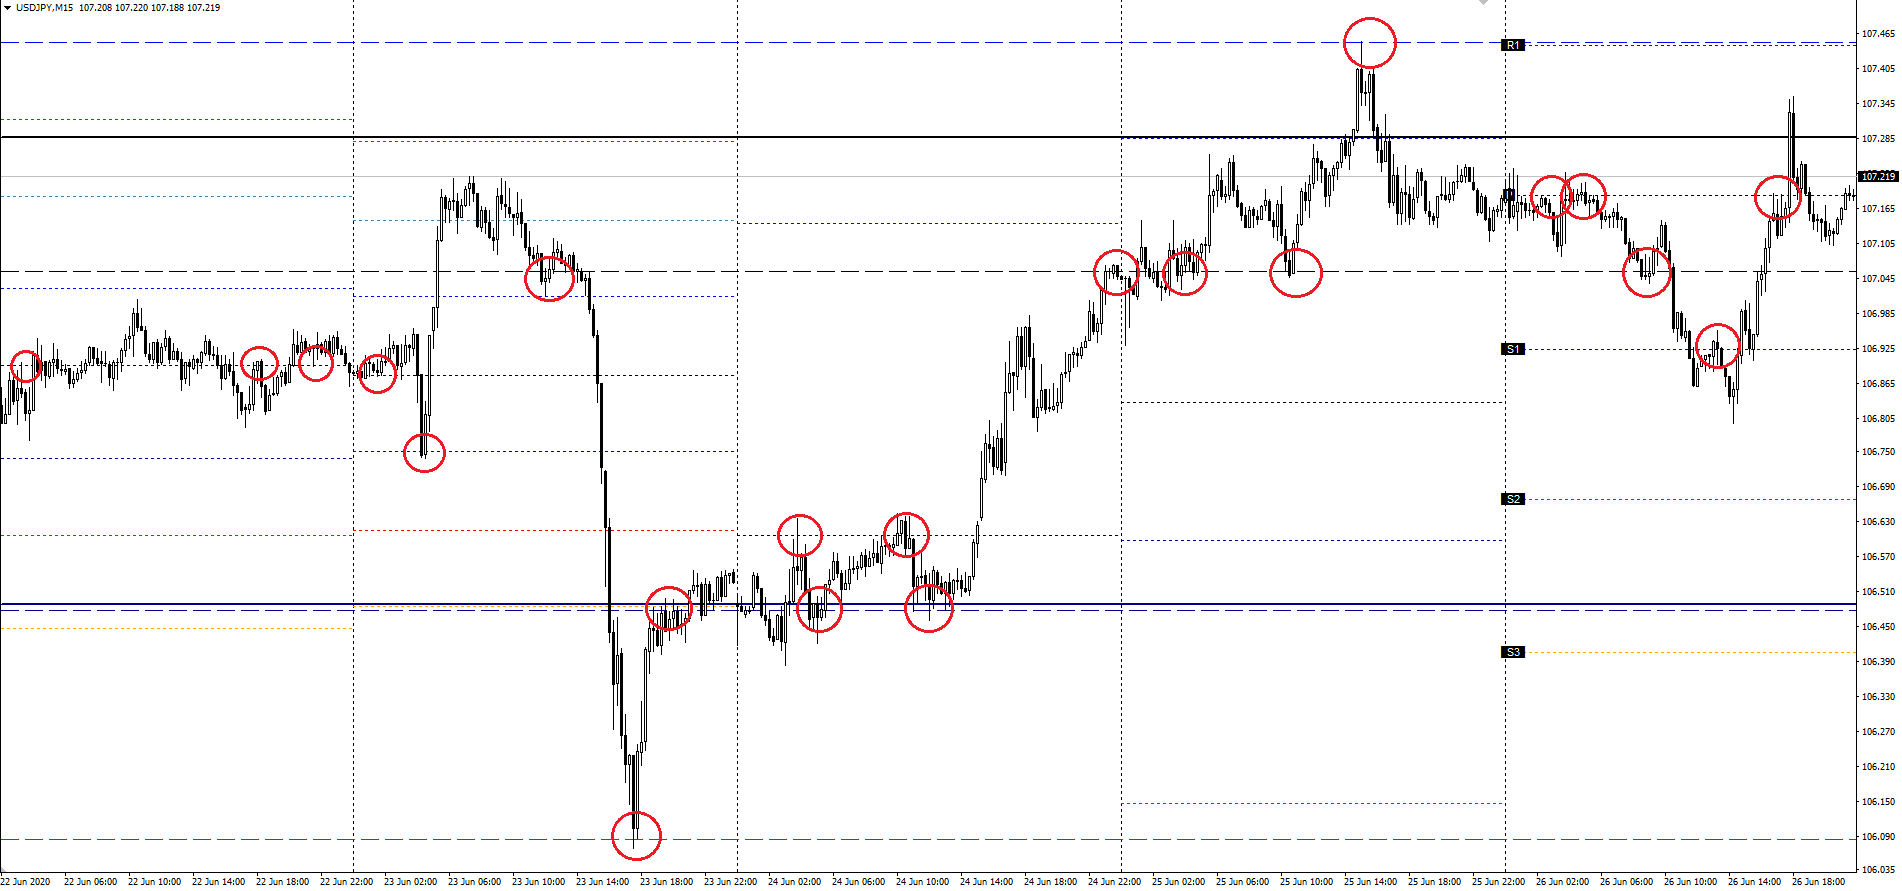
Even if you are told that “many traders watch the same pivot line”, you may find it hard to imagine how much the rate is affected by the line. So, this section uses pivot on the 15-minute chart of EUR/USD during a certain period to take a closer look.
Chart
Tradeview: Innovative Liquidity Connector (ILC Account) MT4
DOT: Daily, DASH: Weekly, SOLID: Monthly, Time: GMT+2.0
As highlighted by red circles, the rate responded to the pivot lines 21 times during this 5-day period. Unlike other trend lines such as support line and resistance line, traders who refer to the pivot watch the same line. There is a possibility that many traders or logics embedded in some trading systems are utilizing these pivots. Even if the rate has seemed to respond to a long-lasting support line multiple times, the reality is that it has responded to pivot lines. If you employ pivot, you may do without drawing a horizontal line on the chart.
②Scalping
As mentioned above, the rate has a tendency to respond to pivot lines. Next, it is important to understand how to utilize it. This section introduces how to utilize pivot lines for scalping.
Chart
Tradeview: Innovative Liquidity Connector (ILC Account) MT4
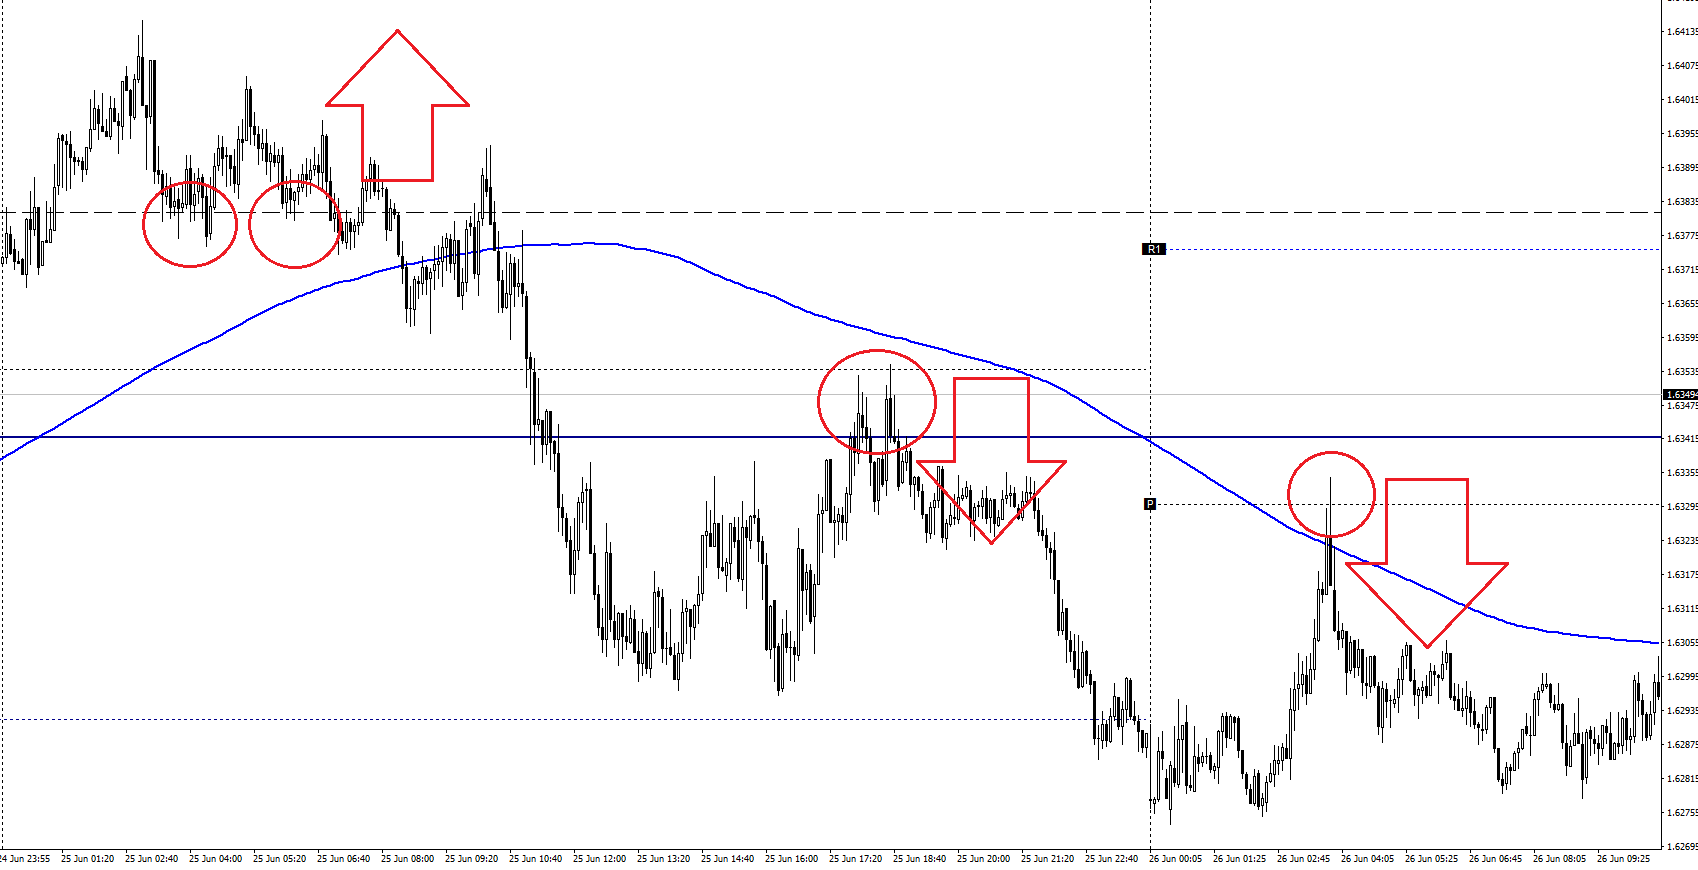
In this figure, pivot lines and the 240-period simple moving average (SMA) are overlapped with the five-minute chart of EUR/USD. For your reference, this chart imitates the environment which displays a 20-period SMA on the one-hour chart.
Providing that the trader configures the response of the rate to pivot lines as the main logic of scalping. Then, the trader adds the filter of 240-period SMA’s tilt on the 5-minute chart to determine the trend. When the SMA shows an upward trend, the trader takes a long position while he/she takes a short position in the opposite trend. And the trader enters the market when the rate touches the pivot.
In this case, the trader should place an order at either of the red-circled points if he/she wants to make a successful trading with the above logic. The detailed result is unknown here because this logic has roughly targets for profit taking and loss cut. But if you want to take multiple pips by scalping, you should utilize pivots since the rate is highly likely to respond to pivot lines.
③Cautions
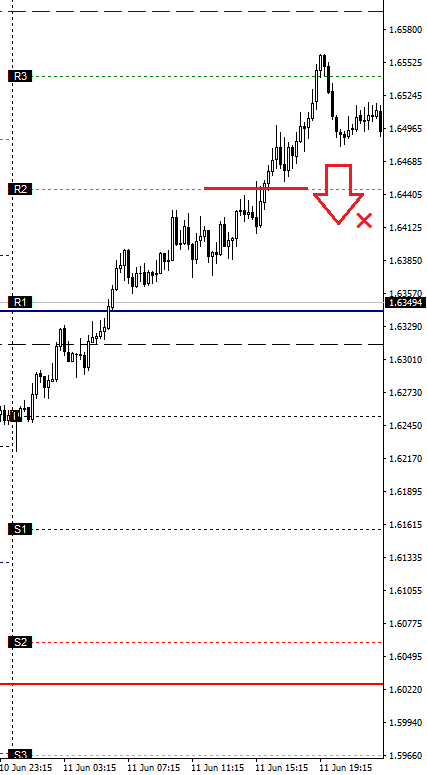
One day, the fifteen-minute EUR/USD chart showed a steep uptrend, as shown above. It gave long-position traders an opportunity to take profits. Many textbooks would say that you should take a short position in anticipation of the correction at R1, and do the same at R2. I disagree with it because taking a short position at R1 or R2 is highly likely to cost the trader under this circumstance. Sure, some traders steadily succeed by taking a contrarian investment strategy. But you should add some sort of technical analysis as a filter to make a trend-following entry.
Also, if you want to forgo any trend indicators except the pivot, you should compare the position of today’s pivot point with the one of the previous day. A pivot point represents the average of high, low and closing prices of the previous day. If the current day’s pivot is located higher than the previous day’s, you can determine that this is a bullish market, and vice versa.
What filter or filters are applied differs between traders. It reflects their personalities, too. In this case, SMA is applied as a filter. But I recommend you to find the indicator which suits your indicator.
Conclusion
Finally, below is the summarization of this article.
・It is highly likely that the rate responds to a pivot line because many traders watch the same line.
・A horizontal line to which the rate responded multiple times may represent a pivot line.
・When utilizing the pivot for trading, you should set the time of chart to GMT+2 (or GMT+3 in daylight saving time) in order to match the daily closing price of the New York market with the one of other markets, as many traders are believed to do so.
・Technical analysis filters for detecting the trends should be added when using the pivot as a main logic.
The pivot line plays a role in giving the rate responsiveness at the line. I hope this article will be of help to your scalping and day trading. Thank you very much for sparing your time to read this article.


