This article introduces a popular indicator ZigZag and how to utilize it.
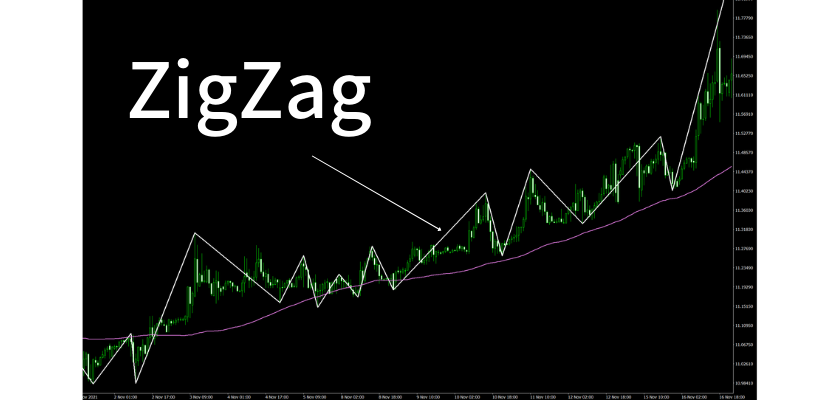
ZigZag connects highs and lows with a line to visualize the price movements of candles. It helps recognize the prices most traders are aware of.
[Summary]
- ZigZag is useful for traders to keep up with market trends and decide the entry point.
- ZigZag indicates the price range between highs and lows to help a trader recognize the price other traders are aware of.
- The ZigZag line’s local vertex or cavity can signify trend reversal as many traders want to make an entry there.
- You should use ZigZag with default settings
Contents
What We Can Do with ZigZag
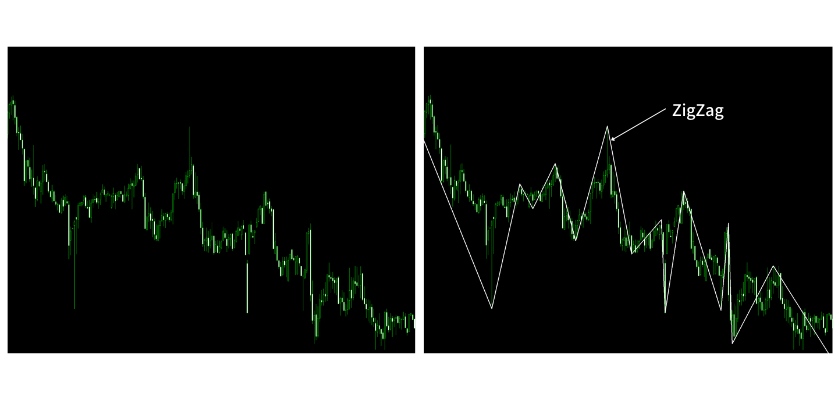
ZigZag connects highs and lows with a line to visualize the price movement of candles. Highs and lows are interspersed in a chart with a series of white and black candles. But many traders sometimes have difficulty understanding the price others are aware of. ZigZag helps us understand it.
ZigZag is very useful not only because it makes it easier to interpret the chart but also because traders using the indicator pay attention to the same price ranges.
Use case of ZigZag
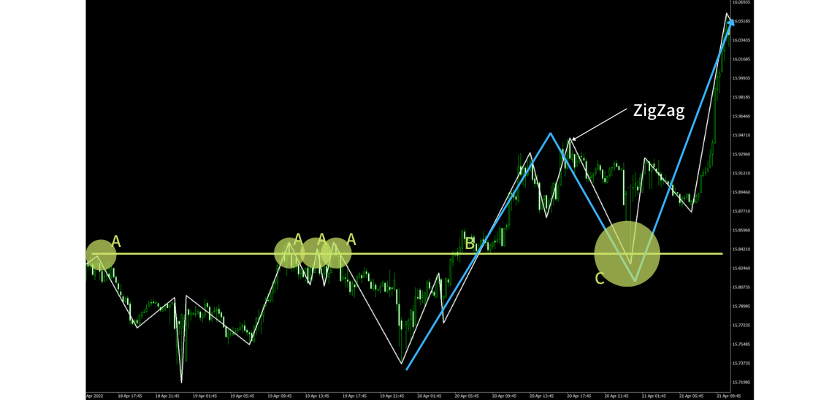
- The upward trend ends as the market hits the resistance line connecting points of A.
- The market breaks the resistance line at B.
- The downward trend ends at C as the previous resistance line turns the support line, and many traders make a buy entry there.
Source: XM MT4 Account, EUR/USD (15-min)
XM Official Website (Outside Europe)
ZigZag tells trades where the market is about to rebound as most traders are aware of the price range like A. In other words, ZigZag’s local vertex or cavity is the price where many traders target to make a buy or sell entry.
How to Import ZigZag into MT4
ZigZag is available from MetaTrader 4 (MT4) provided by the following brokers, all recommended by this site.
XM Official Website (Outside Europe)
To import Zigzag into MT4, proceed to [Insert]-[Indicators]-[Custom]-[ZigZag].
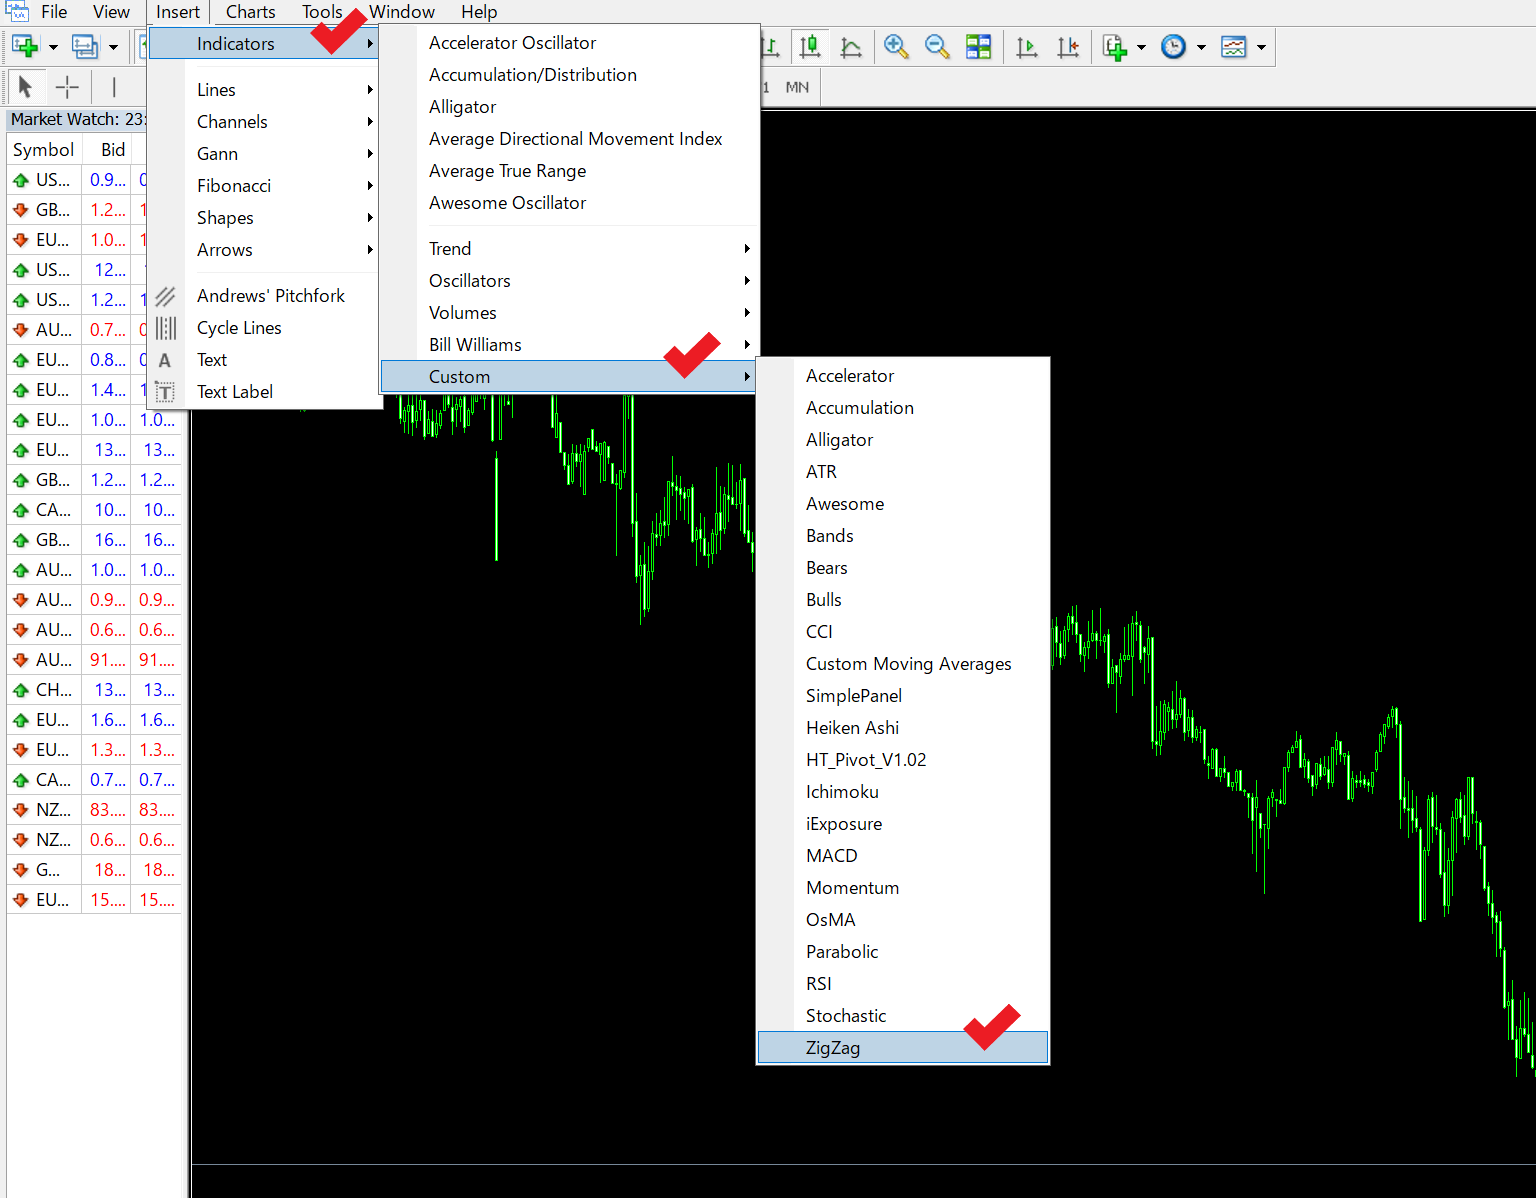
Source: XM MT4 Account, EUR/USD (15-min)
XM Official Website (Outside Europe)
How ZigZag Does Calculation
Overview of ZigZag Parameters
Zigzag uses the following three parameters for calculation, or to form the zigzag line.
- Depth: The minimum pips at which ZigZag does not build the next max/min
- Backstep: The minimum number of candlesticks between adjacent local max and min.
- Deviation: The minimum value of the number of points in percentage between min and max of two adjacent bars
ZigZag forms a new local vertex or cavity only when the above conditions are met.
Recommended ZigZag Parameters
To align with other users, it is recommended to use ZigZag with the following default parameters.
Depth: 12
Backstep: 3
Deviation: 5
Example of ZigZag Calculation
For Zigzag to form a new local vertex or cavity, all conditions should be met. In the case of the above default setting, the price should move 12 pips or more from the previous high or low, three or more candlesticks should be lined up, and the price should bounce back or fall back by 5% or more from the previous low or high.
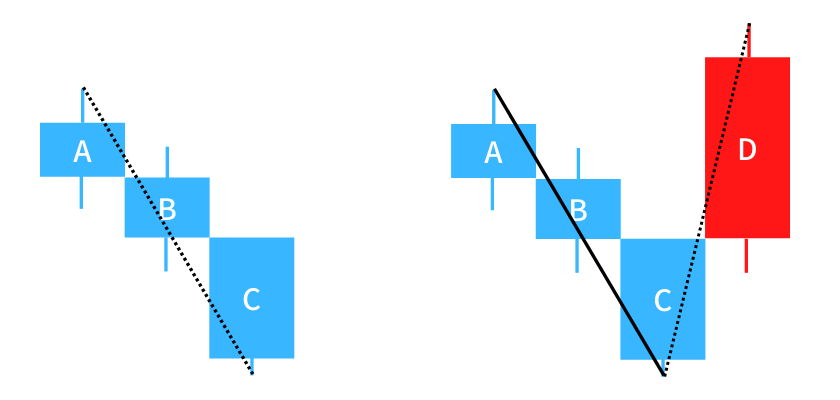
Dotted line: ZigZag line under formation
Straight line: Formed ZigZag line
Application of ZigZag
Use ZigZag to Identify Trend
The ZigZag line, which connects the highs and lows of candles, allows us to interpret the market trend easily. Dow Theory, the basic tenet of trend analysis, defines a trend as follows.
- Uptrend: When the market establishes a new peak higher than the previous peak and a new trough higher than the previous trough.
- Downtrend: When the market establishes a new peak lower than the previous peak and a new trough lower than the previous trough.
- Trend reversal: When the market cannot create another successive peak and trough in the direction of the primary trend.
For example, if the latest high does not outmatch the previous high while the latest low hits below the previous low, this is a sign of the uptrend’s conclusion. As the ZigZag line visualizes the highs and lows, combining ZigZag with Dow Theory to identify the current trend or its possible reversal is a basic use of ZigZag.
Use ZigZag to Determine Entry Point
As mentioned above, Zigzag’s local vertex or cavity can be interpreted as the price range where many traders target to make an entry. This method utilizes this feature.
Here, we take a look at how to determine the entry point by using ZigZag and 80-period simple moving average (SMA).
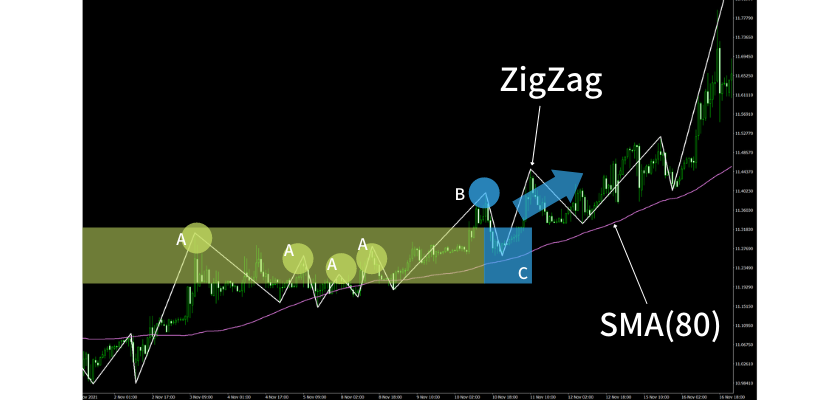
Source: XM MT4 Account, EUR/USD (hourly)
XM Official Website (Outside Europe)
- The market moves sideways slightly above SMA as it falls back at the area of (A) multiple times.
- Then, the market goes above the range and reaches (B). In parallel, SMA turns upward.
- You may be inclined to make a buy entry here, but it is better to wait for a reaction.
- So, you should make an entry when the market falls to the area (C) which aligns with the previous resistance range.
To set up the above strategy, you should understand the highs and lows other traders are aware of. With ZigZag, you can grasp such crucial points.
Conclusion
- ZigZag is useful for traders to keep up with market trends and decide the entry point.
- ZigZag indicates the price range between high and low to help a trader recognize the price other traders are aware of.
- The ZigZag line’s local vertex or cavity can signify trend reversal as many traders want to make an entry there.
- You should use ZigZag with default settings
Thank you for sparing your time to read this article.
Information on Best Broker by country
This site also introduces the best broker(s) for each trader's country of residence.
【Popular Broker】 Well-reputed FX Broker by Country
Just select your country, and you will be able to find a list of the best broker(s) operating in your country. I hope this will be also helpful to find the best broker for you.
