There are mainly three reasons why HotForex is highly preferred by many traders.
- There is no trouble such as the refusal of a withdrawal request.
- Processes of deposit and withdrawal can be completed swiftly and without fees.
- Various bonus programs are provided by the group company HF Markets (SV) Ltd (details →)
HotForex is noteworthy for its large company size, no deposit and withdrawal problems due to ample funds, and various bonus programs which allow traders to increase their trading efficiency.
However, it can be said that, in addition to these factors, HotForex also provides excellent "custom indicators". They are used by traders above the intermediate class free of charge (conditions shall apply).
This article summarizes conditions of use and how to download the custom indicators, and then introduces the typical use of Pivot Points (pivot) as a practical way to use them in trading. Pivot is the indicator that gave me the opportunity to steadily succeed in FX trading. I will show you why pivot works and some of my actual trades for your reference.
Instagram (I sometimes post trades using pivot) →
I hope this will be helpful for those who are looking for a good broker and a good trading method.
[Caution]
- The information hereinafter includes subjectivity of the author and its credibility is not guaranteed. Final decisions on the transaction should be made at your own discretion.
- In order to maintain the rarity of my own logic, the filtering method and recent trade results won’t be disclosed. Please validate which filter functions by yourself. In the future, more and more traders would be able to succeed better than me (in case I decide to release all of my logic and recent performances, I would plan to make it through a paid service or in any other ways).
Contents
List of Custom Indicators, Conditions of Use, and How to Download Them
For details of HotForex’s custom indicators, please refer to HotForex official website →
Indicator list
- Pivot Points
- Mini chart
- Highs and Lows
- Renko bars
- Chart Group
- Symbol Info
- Gravity
- Chart-in-Chart
- Magnifier
- Order History
- Freehand Drawing
- Bar Changer
- Keltner Channel
- Donchian Channel
- Candle Countdown
Conditions for Using Custom Indicators
To download the indicators for free, a trader should deposit more than USD 200.00 to his/her own trading account and then maintain the balance not to be below USD 200.00 for at least 30 days.
How to Download Indicators
①Open a real account with HotForex
②Deposit more than USD 200.00 in your account and retain it for more than 30 days.
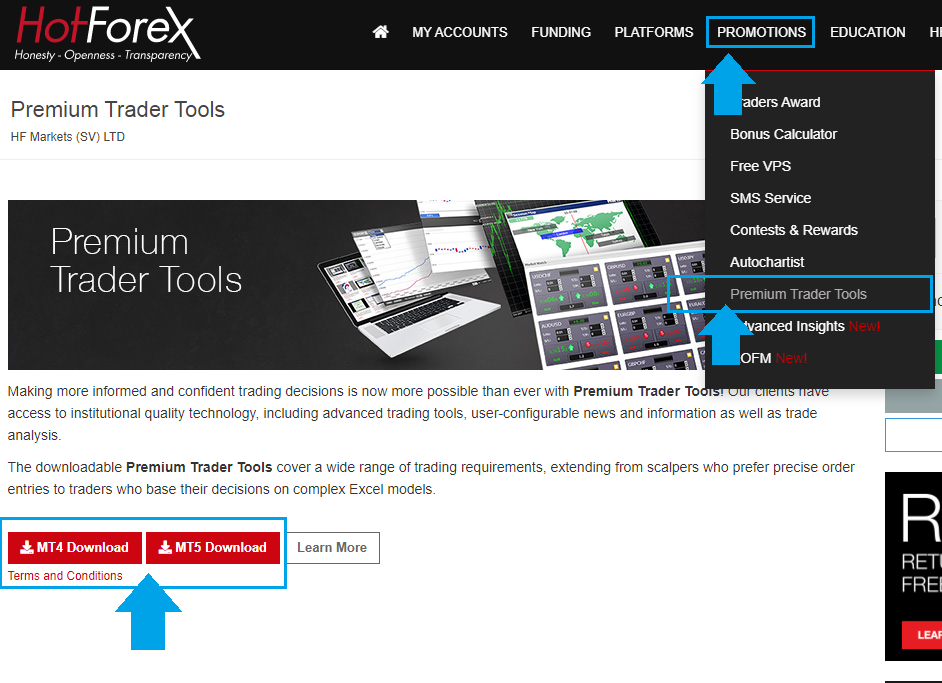
③After the above conditions are met, go to the account managing site and download indicators from [Promotions] > [Premium Trader Tools] > [MT4 / MT5 Indicator Package].
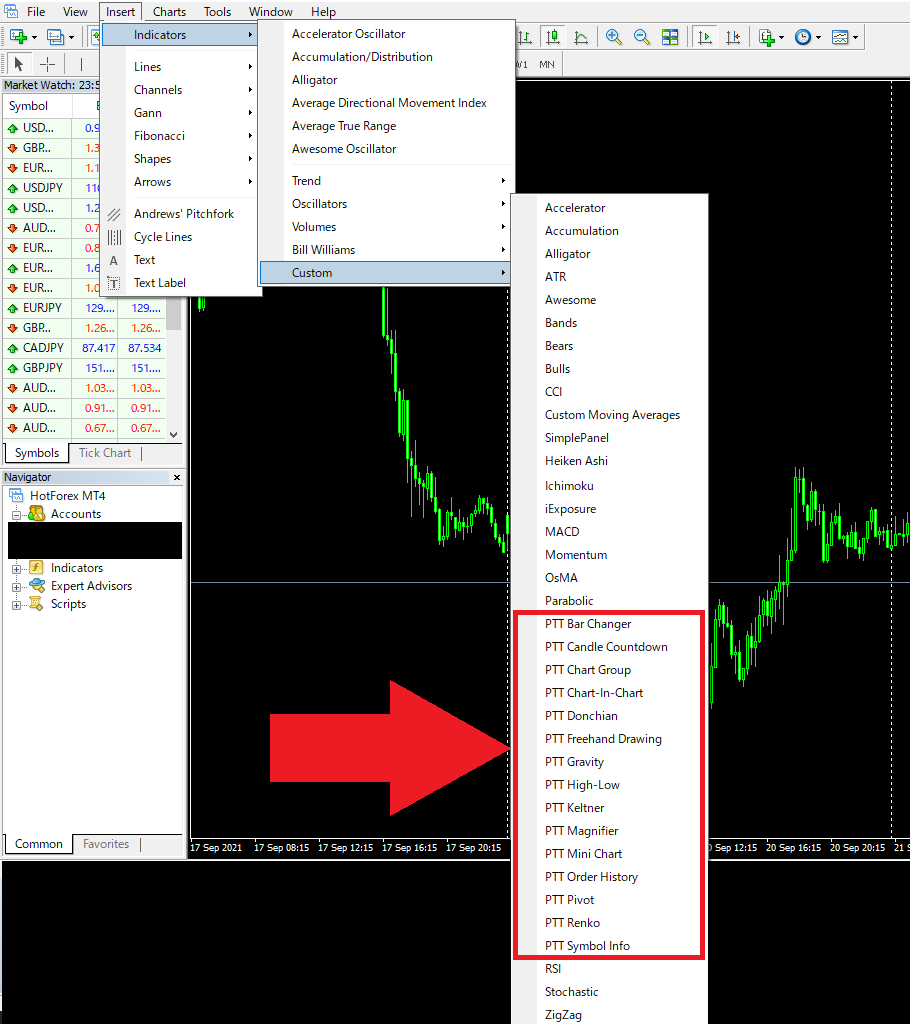
④After the indicators are downloaded successfully (as the files are compressed, please extract them all), they will be reflected in MT4. You can use the custom indicator by selecting [Insert]-[Indicators]-[Custom].
Practical Application of Pivot for Trade
Pivot Points
I consider Pivot Points, a HotForex version’s pivot, to be the most practical of the custom indicators offered by HotForex. This section gives a brief overview of the pivot and then partially introduces how I use it myself.
Please take a look at the following article for a general overview of the pivot.
Related article: [PIVOT] How to Utilize Pivot for Technical Analysis
Why Pivot Is Effective against Market
Pivot, a type of "leading indicator", provides the same line for many traders. As the pivot is calculated from the previous day's price, they are watching the same chart and thus the same line.
- Leading indicator: Like pivot, it shows the line and other indicators toward the future.
- Lagging indicator: Like the moving average (MA), it shows a line against the past rates.
An indicator that changes the line depending on the set value, such as MA, has the disadvantage that judging criteria varies between traders. Pivot, on the other hand, uses the predetermined formula to automatically calculate the line based on the previous day's price when the date changes. That is why many traders watch "the same line". Also, as the convergence of orders causes price fluctuations, pivot frequently shows the rate reversal.
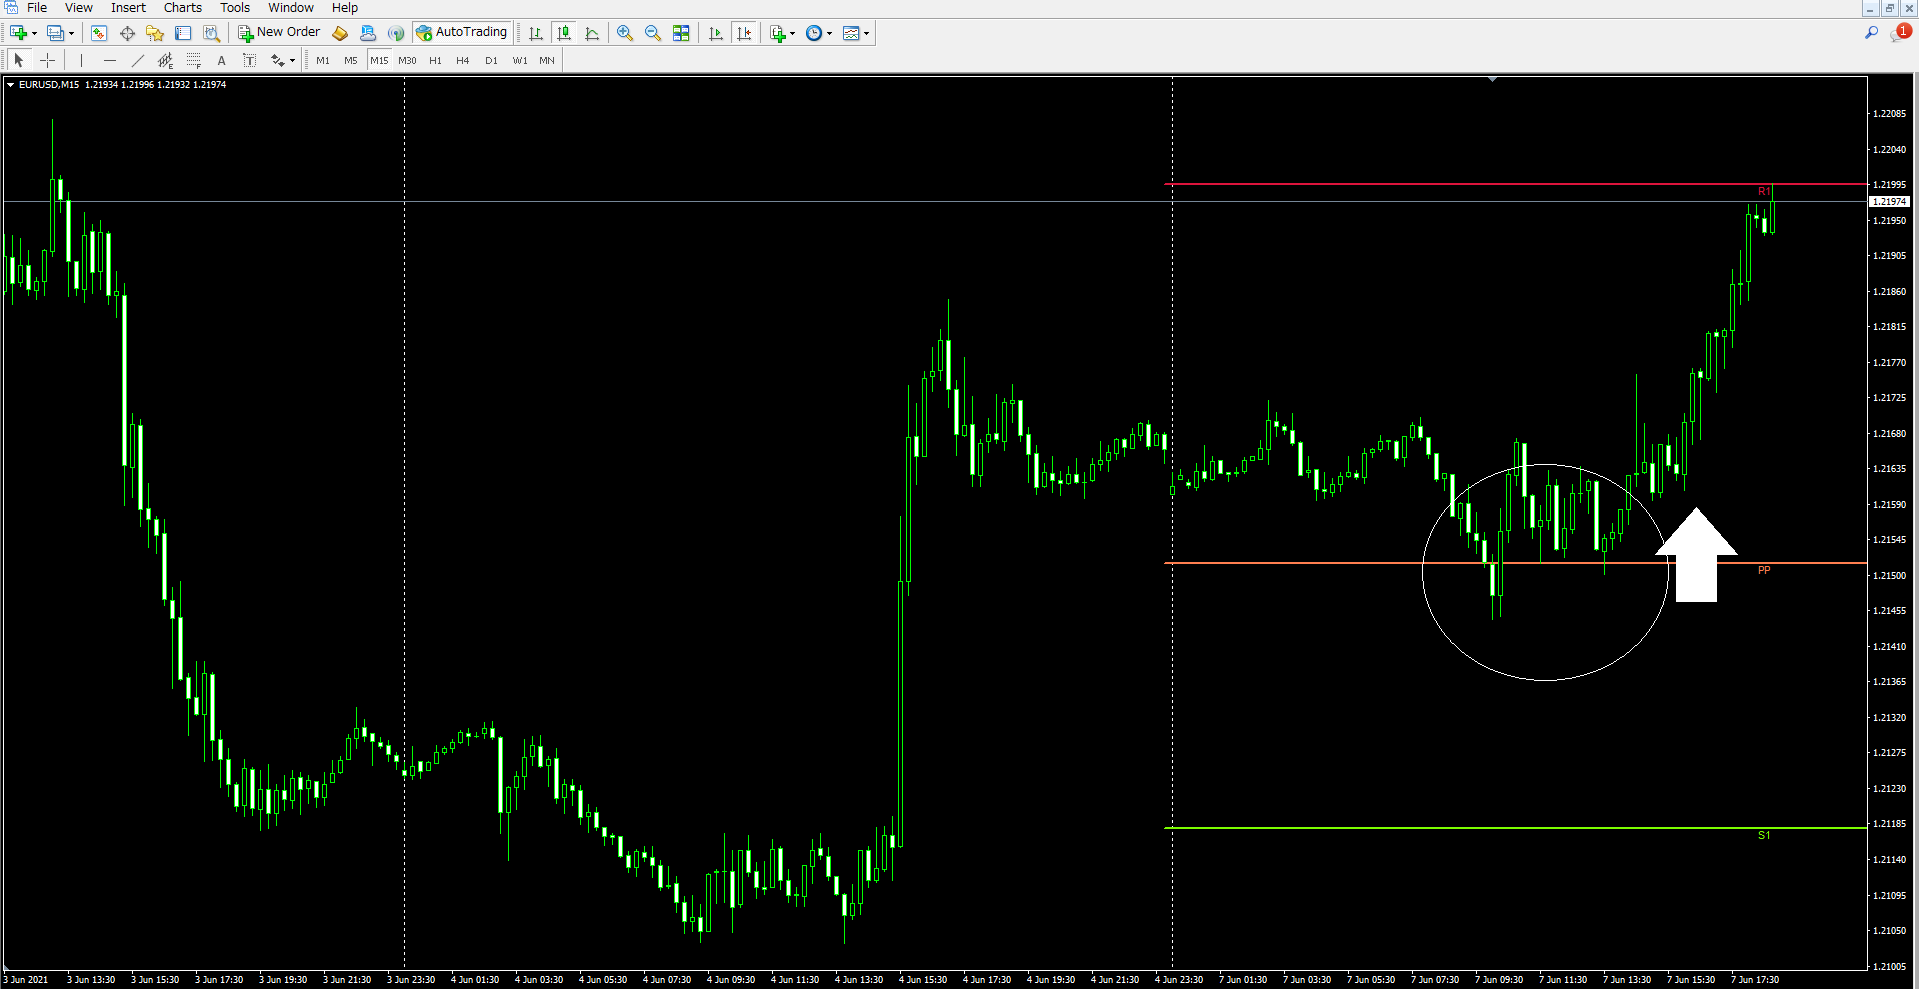
The above figure shows the rate reversing at the pivot point, which is often seen in the market. Technical analysts may often say "The price has reversed at the long-range support line". The above figure shows the rate reversing at the pivot point, which is often seen in the market. In such a case, pivot usually plays a crucial role.
Notes on Using Pivot for Trade
It is recommended to apply the pivot to MT4 (MT5) charts with a time setting of GMT+2.0 (Daylight Saving Time: +3.0) so that you can align with the same time axis as traders around the world. For example, when MT4 or MT5, including the one provided by HotForex, indicates 00:00 of April 1, it matches 17:00 of March 31 in New York. Generally, the price at the closing time of the New York market is considered as the closing price of the day. As the pivot is calculated based on the price of the previous day, you can get to your eye level with other traders and your trading accuracy can be improved.
Trading Logic Using Pivot
How to utilize pivot varies between traders. In fact, I parallelly run the following trading logics.
- The logic used to decide the entry
- The logic used to decide both entry and exit
- If the rate is above the Pivot Point, the strategy is to buy; if it is below, the strategy is to sell.
By operating multiple logics in parallel but applying each logic to the respective account, it is possible to diversify investment risks. This section introduces a part of the above logic 2.
How to Utilize Pivot to Decide Both Entry and Exit
Trade Logic Overview
| Image of Entry | When the daily pivot is renewed, focus on a reversal of the line closest either to "Pivot Point", "R1", or "S1". |
| Points of Entry | “Pivot Point", "R1", "S1", "Previous Day High", and "Previous Day Low" of "Daily Pivot" are used as the settlement line. Compare the profit margin and the loss-cut margin and make an entry only when the former is wider than the latter. |
| Filter | Use the filter to determine whether to make an entry (details of the filter used are not disclosed).
Example: If the interval of pivot is wide, i.e., the price range of the previous day is large, pivot tends not to work. So use volatility as a criterion (filter) to determine whether to make an entry. |
| Fund Management
(Lot size) |
How to manage the fund varies from traders.
Pattern 1: Do the trading within the set amount of currency. Pattern 2: Set the stop loss amount to a specified percentage (in general, between 1% and 3%) and adjust the lot size to be traded to keep the amount of loss constant even if a stop loss occurs. |
| Characteristics of this method (1) | If the win rate is above 50%, it is expected to earn a large profit thanks to the wider profit margin than the loss-cut margin. |
| Characteristics of this method (2) | The pivot updated upon date change can be shared by many traders. As a result, they tend to place an order at the same point, which causes the chart to show the rebound. This method shows such a property of traders more clearly than checking support lines or drawing moving averages by the trader’s own discretion. |
In order to increase the winning rate using this method, it is necessary to reduce the number of unsuccessful trades, not to increase the number of successful ones. Here, I used volatility as a criterion (filter) to determine the entry, but you may find the filter more suitable for you.
Explanation Using an Actual Chart
Now we take a look at how to use this logic to do the trading in reference to the actual chart. The below shows the chart of EUR/USD between May 13 and 14, 2019.
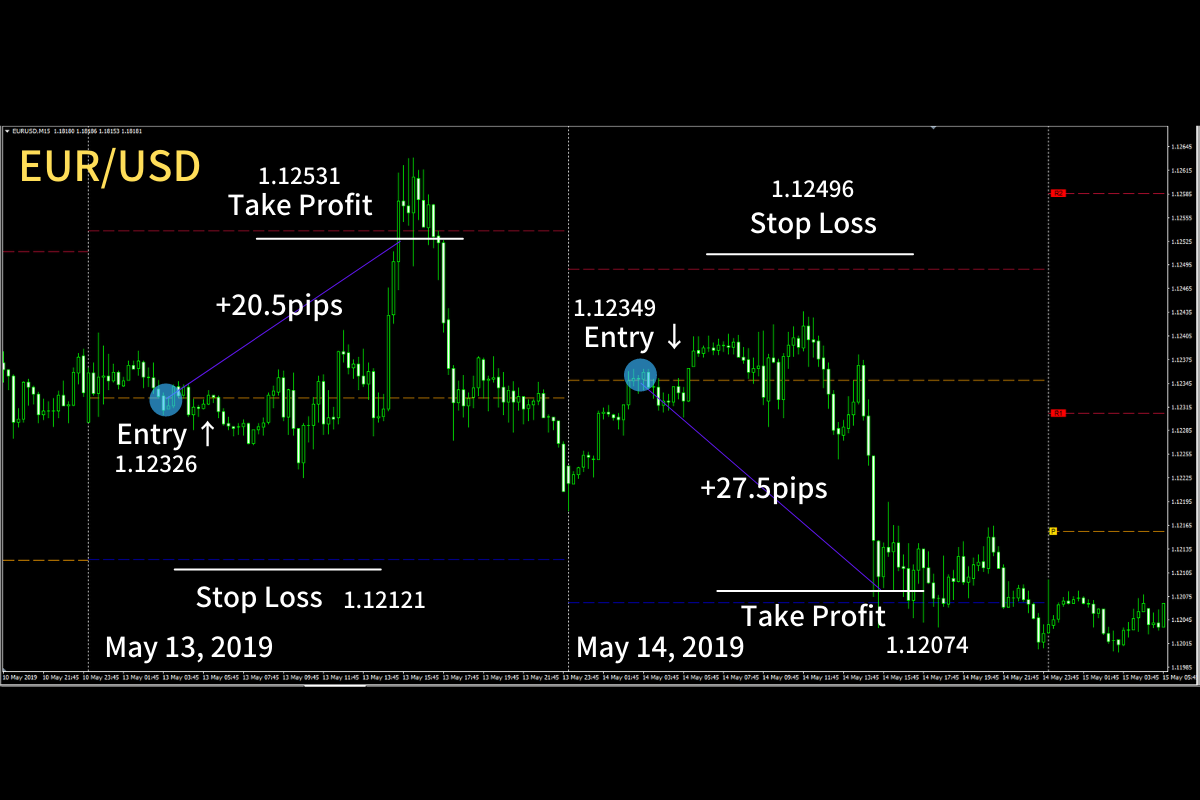
(HotForex provides the pivot of the day but does not display the pivot of the previous days on the chart. Here, for the sake of clarity of explanation, I use my original program to display the pivot of both days).
May 13, 2019
| Entry | When the date changed to May 13, the rate was slightly above Pivot Point (Daily Pivot). So I decided to take a long position decision targeting a reversal at this point (Pivot Point: 1.12326, Buy Entry) |
| Profit-taking line | R1 of Daily Pivot as the profit-taking line (R1: 1.12531 TP) |
| Loss-cut line | S1 of Daily Pivot as the loss-cut line (S1:1.12121 SL) |
| Result | +20.5pips |
May 14, 2019
| Entry | When the date changed to May 14, the rate was slightly below Pivot Point (Daily Pivot). So I decided to take a short position for a reversal at this point (Pivot Point:1.12349 Sell Entry) |
| Profit-taking line | S1 of Daily Pivot as the profit-taking line (S1:1.12074 TP) |
| Loss-cut line | R1 of Daily Pivot as the loss-cut line (R1:1.1.12496 SL) |
| Result | +27.5pips |
The rate does not always reverse whenever it touches the pivot. The important thing is how to reduce the number of unsuccessful trades, and which filter is used depends on the traders.
Why Does This Logic Work?
- The pivot (Daily Pivot) is updated and displayed as soon as the date of MT4 (MT5) changes. So it is easy to place a reservation order using the pivot. It is especially convenient for the by-business traders such as company employees.
- Traders have only to check the chart as it really is without following the trend of the upper legs.
- Traders executing transactions at their discretion need to make decisions based on many factors such as "support line", "resistance line", "double bottom", and "double top". Meanwhile, pivot allows traders to focus on where the pivot will work, lessening the unnecessary stress.
Drawbacks of Pivot
The trading logic using pivot does not always work as expected and you may have a series of unsuccessful trades.
From my personal experience, this section introduces when pivot does not work.
- Trading between minor currency pairs
- Low liquidity
- Before and immediately after the release of major economic indicator
Trading between minor currency pairs
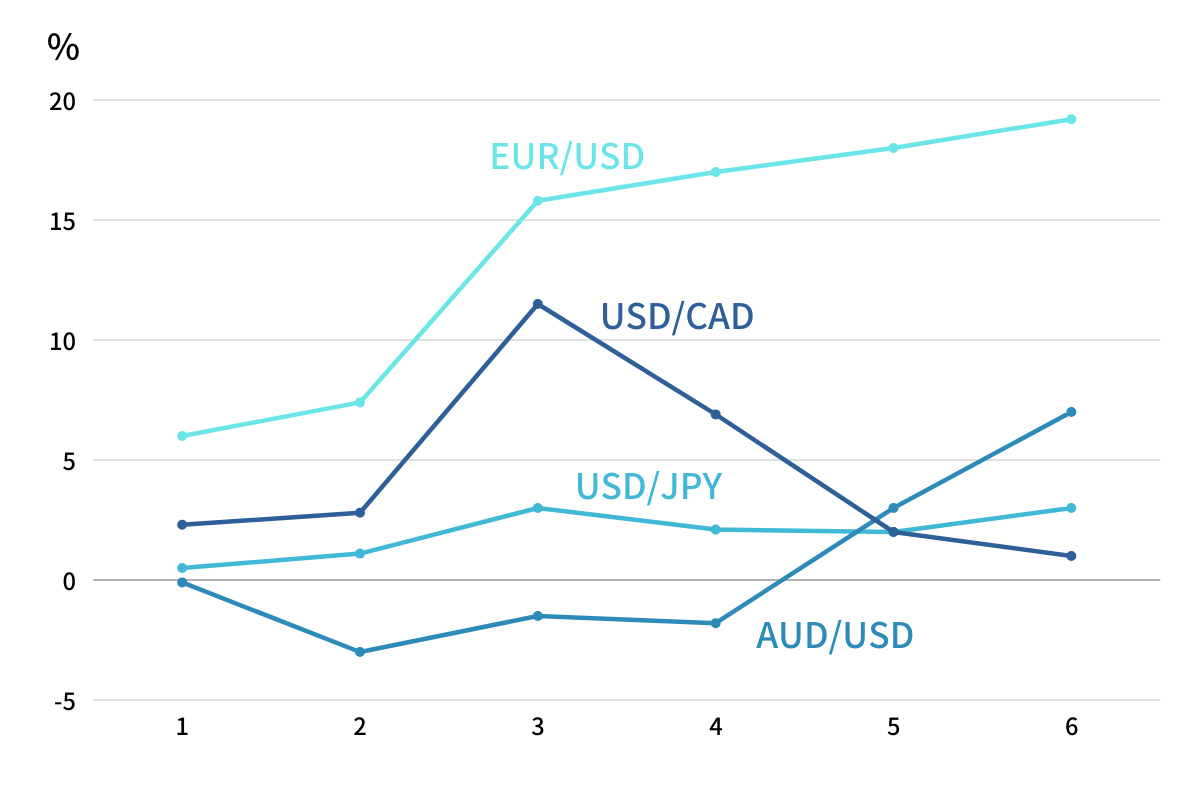
Figure: Performance of each currency pair using a pivot logic (Jan-Jun 2018)
This figure shows the performance results using a pivot logic between January and June 2018. While EUR/USD had made steady growth, other currency pairs had not achieved such growth. Many traders using pivot might have experienced this. As long as the most circulated currency in the world is USD, followed by the EUR, EUR/USD may respond to the pivot in a straightforward manner.
[Countermeasure]
Use pivot for the trade of major currency pairs.
Low liquidity
It can be often seen that pivot does not work when the market is inactive, such as during the holiday season. This is due to a decrease in liquidity. However, the lack of performance due to low liquidity is not limited to the pivot logic.
[Countermeasure]
Avoid trading during periods of low liquidity, such as the holiday season.
Before and immediately after the release of major economic indicators
Before and after the release of major economic indicators such as the U.S. job figures, it is frequent that the decrease in liquidity and/or uncontrollable volatility occurs. In this case, the pivot easily tends to lose its functionality.
[Countermeasures]
Avoid trading before or immediately after the release of major economic indicators.
Bottom Line
What to keep in mind when using pivot is as follows;
- Trade between major currency pairs
- Avoid trading when the market is inactive
- Avoid trading when the decrease in liquidity and/or increase in volatility is predictable, such as before the release of major economic indicators.
This concludes the introduction of how to apply the pivot logic for trading.
I hope you can feel pivot's superiority as a leading indicator.
If you are in the process of building a new trading logic, you may want to try pivot.
Click here to open an account with HotForex where you can use the custom indicator. → Official Site
HotForex's [Custom Indicator Introduction Page] (official site) is here. →
I hope this article has given you some tips for building your trading logic.


