Take a closer look at how to use the horizontal line?
A horizontal line plays a role in a sign of trend reversal. It functions as a resistant range at a certain level where the price is likely to rebound or hit the ceiling.
A horizontal line enables you to prepare for the buy entry in anticipation of rebound as the line is regarded as a support line or profit-taking as much as possible in anticipation of reversal as it is regarded as a resistance line.
A horizontal line is so simple but strong a tool that it will be of great help to your trading.
Contents of this article:
・What Is a Horizontal Line?
・What Is “The Price Range Where Investors Are Aware of”?
・Breakout of Horizontal Line
・Why Does a Breakout Change the Nature of a Horizontal Line?
・Where Should a Horizontal Line Be Drawn?
・How to Use a Horizontal Line to Determine the Entry?
Contents
What Is a Horizontal Line?
First, we take a look at what a horizontal line is.
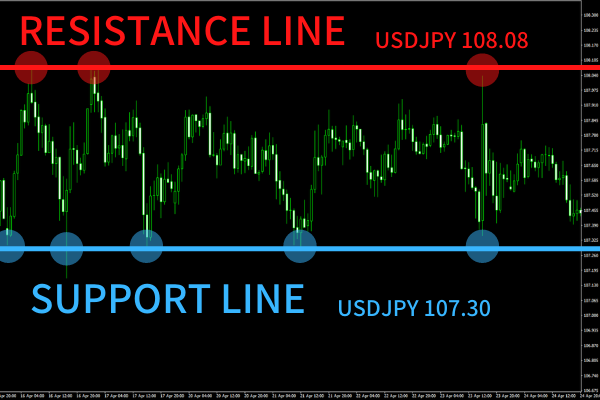
A horizontal line connects high prices or low prices in a horizontal fashion. Or you can draw it at rough numbers such as the USD 1.2000-to-the-euro level or JPY 110.00-to-the-dollar level. There are two types of horizontal lines.
①Resistance Line
②Support Line
A resistance line functions as a ceiling which curbs the uptrend while a support line functions as a floor where the price is likely to rebound there.
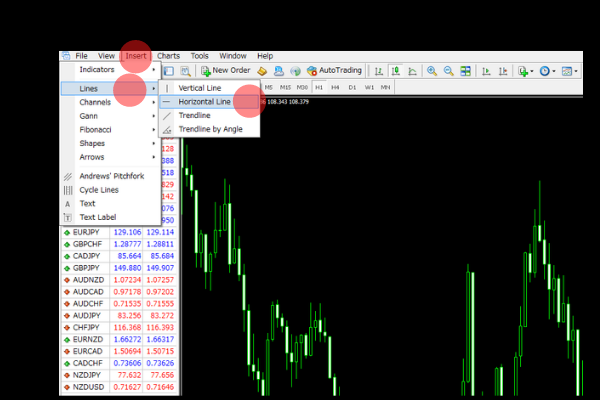
(On MT4, a horizontal line can be inserted from the “Insert” > “Lines” > “Horizontal Line” menu.)
Chart
Tradeview: Innovative Liquidity Connector (ILC Account) MT4
Why is the momentum of uptrend or downtrend likely to be weakened as the price approaches the line? This is because it is drawn at the price range where many investors are particularly aware of.
What Is “The Price Range Where Investors Are Aware of”?
As mentioned above, a horizontal line functions because it is drawn at the price range where investors are aware of. So what does it mean?
<Question>
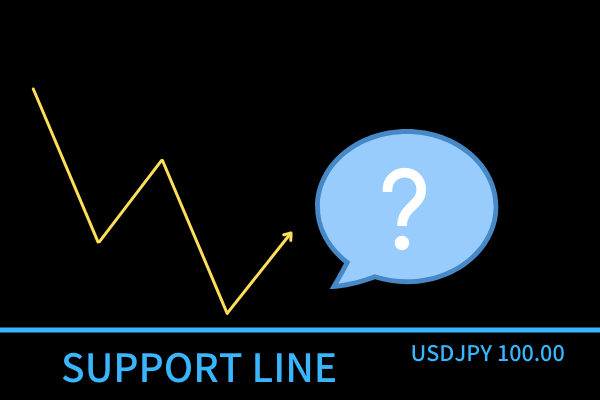
The USD/JPY market has been supported at the JPY 100.00 level for a few years. Now the price is coming closer to it. How would many traders think of it?
<Discussion>
・Short-position traders would close their position to take profits, i.e. place a buy order, when the price comes close to the level.
・Traders considering to place a fresh buy entry would anticipate the rebound at the level.
Many buy orders converge at the level of the support line as short-position traders do transactions to close their positions and other traders make a buy entry. It makes the rate upward and that is why a support line functions.
Many investors actually rely on a long-term support line and resistance line to establish their trade plan, because they are so easy to understand the past price movement.
Breakout of Horizontal Line
When the price clearly goes above a resistance line or beneath a support line, forex traders call it “breakout”.
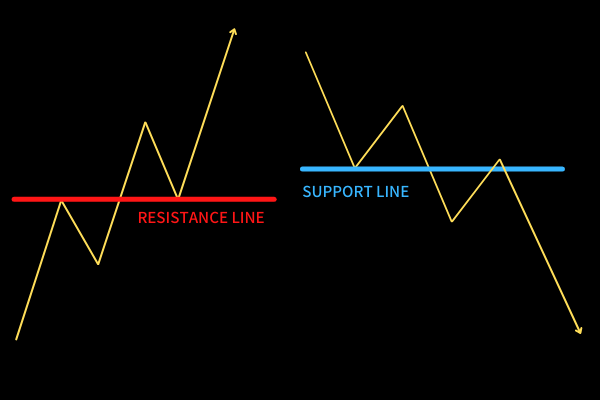
When a breakout occurs, the rate is likely to show a strong uptrend or downtrend. It hugely reflects investors’ sentiment.
<Question>
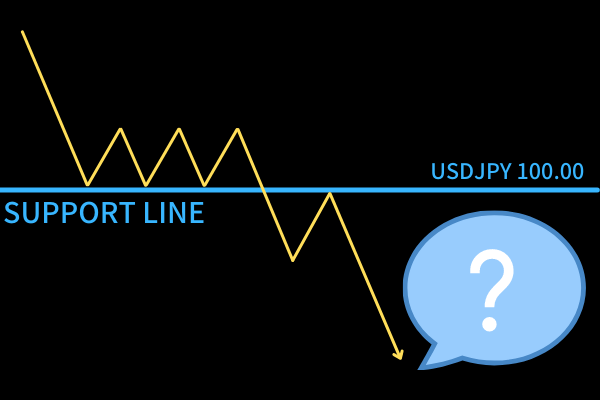
The USD/JPY market has been supported at the JPY 100.00 level for a few years. But the breakout occurred today as the price fell beneath the support line. How would many traders think of it?
<Discussion>
・Short-position traders would make another sell entry, i.e. place a sell order, because this is the first breakout in years and the momentum of the current downtrend outweighs the long-term resistibility of the line.
・Long-position traders would decide to make a loss cut to restructure their own trading plan.
When the price breaks above or falls below a long-lasting horizontal line, additional sell orders placed by traders who have formed this breakout overlap with loss-cut orders placed by traders who have not predicted it. Therefore, the rate is likely to show the uptrend or downtrend after the breakout.
Why Does a Breakout Change the Nature of a Horizontal Line?
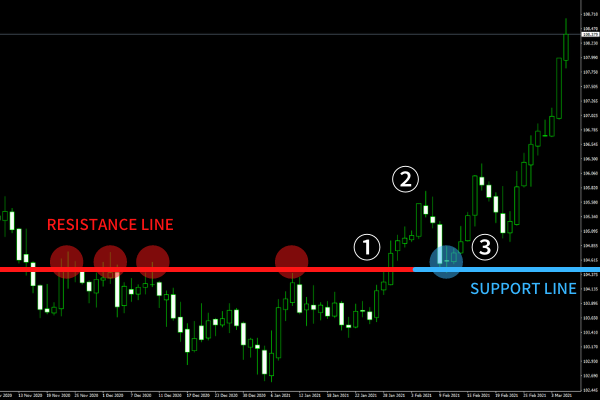
A breakout of the horizontal line turns a resistance line into a support line or a support line into a resistance line.
Chart
Tradeview: Innovative Liquidity Connector (ILC Account) MT4
①When a long-lasting resistance line was clearly broken out, two types of buy orders converge; loss-cut orders placed by trades who have made sell entries in anticipation of rebound and new buy orders placed by traders who want to utilize the uptrend. Then the rate surges temporarily.
②Profit-taking orders briefly bear the market.
③Traders who missed the uptrend at ① and those who determined that the rate has broken above the resistance line place buy orders, which boosts the market again.
The chart reflects a series of reversal and growth around the break point. When the price temporarily retreats to the broken horizontal line, it is called “roll reversal”. There are many traders who decide to make an entry after confirming the breakout and roll reversal.
Multiple horizontal lines can be drawn on the basis of quarter-hour, half-hour, an hour, four hours and daily charts. The market repeats reversals of trends and breakouts, and the chart reflects the movement.
Where Should a Horizontal Line Be Drawn?
The way to draw a horizontal line differs between traders. But many traders employ either of the following lines.
①Round Number (EUR/USD: 1.20000 or USD/JPY: 110.000 etc.)
②Multiple highs or lows visually identifiable on a chart larger than an hourly chart.
③Neckline
④Higher low and lower high
①Round Number
Many traders are aware of a certain round number. For example, some traders are thinking “When the USD/JPY rate reaches the JPY110.000 level, let’s enter the market in anticipation of reversal” while some want to take profits at the level of 1.2000 at EUR/USD market. Such a round number can be a rough indication for transactions.
②Multiple highs or lows visually identifiable on a chart longer than an hourly basis.
The longer the time frame chart a horizontal line is drawn on, the more value the line has. This is probably because the longer time frame chart, such as a daily chart or weekly chart, draws the attention of many traders than one-hour chart or four-hour chart.
③Neckline
Neckline is a horizontal line drawn at the origination where the downtrend market failed to hit a fresh low for the first time, or the uptrend market failed to break the previous high.

Chart
Tradeview: Innovative Liquidity Connector (ILC Account) MT4
The above chart shows the upward breakout of the neckline after a long-term downtrend. Short-position trades who created the downtrend tend to start to hold a position in order to do the transaction, or make a loss cut, at ①. When the market hit the new low and reached the level of ②, the settlement line moved from A to B. Short-position traders wanted the rate to further fall down as they could earn more profits. However, it would not hit another low, rebounded at the level of ③ and broke above the neckline. When the rate failed to hit a new low, traders who confirmed the conclusion of downtrend placed buy orders around the level of the neckline. As a horizontal line is known to reflect the investor sentiment like this, many traders pay attention to it.
④Higher low and Lower high
“Higher low” means the original point of upward movement before hitting a new high in the midst of uptrend.
“Lower high” means the original point of downward movement before hitting a new low in the midst of downtrend.
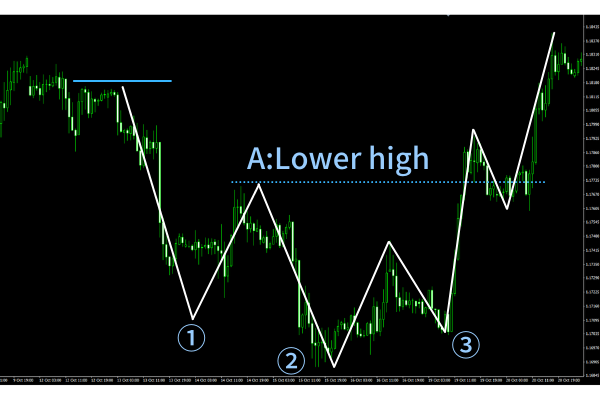
Traders are concerned about when the current trend finishes. Breaking above a higher low or falling below a lower high can be a definitive sign. The above chart shows the lower high. In this case, many traders determined that when the market broke above it, the lasting downtrend had been concluded. Similar to neckline, higher low and lower high function as a horizontal line.
How to Use a Horizontal Line to Determine the Entry?
Finally, we take a look at how to use a horizontal line on the USD/JPY weekly chart as of March 2021 to determine the entry.
<Pattern 1>
First, use the support line on the weekly USD/JPY chart to confirm whether the market has rebounded around the level of JPY 100.00. After the confirmation, use the daily chart to determine the timing of buy entry.
<Pattern 2>
Use the support line on the weekly USD/JPY chart to anticipate the rebound.
Both buy entry patterns use the same weekly chart of USD/JPY but each method differs a little. The area highlighted in yellow is where the entry is made.
<Pattern 1>
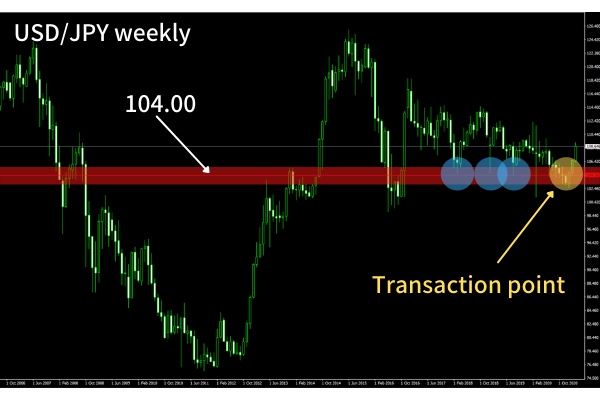
<Discussion based on the weekly chart>
・The trader confirmed that the market rebounded in the blue circle areas. It says that the support line can be drawn at the level of JPY 104.00 (as the weekly chart has a very long time window, detailed numbers should be removed).
・On a weekly basis, when the USD/JPY market touched the yellow area, it was in the midst of coming down to JPY 100.00 level. But since the USD/JPY market has not long fallen below that level, it was anticipated that the trend reversal might occur. So the trader started to prepare for a buy entry.
<Discussion on the basis of daily chart>

・When applying the weekly-based horizontal line on the daily chart, it tells that the line functioned both as a support line and resistance line.
・The market rebounded at the points of A, B and C and hit the ceiling at the points of D, E and F. Therefore, a horizontal line can be drawn at the level of JPY 104.30, a little higher than the weekly-based line.
・The rate actually rebounded at the point of G and then broke above the neckline (N).
・The trader could make a buy entry either after confirming the breakout of neckline at ① or roll reversal at ②.
・While the trader set a loss-cut line at the H level, the trader could take profits by confirming the price movement.
・The rate soared as the short-position traders who had formed the lasting downtrend placed buy orders for profit-taking or loss cut and traders anticipating the rebound at the level of JPY 104.30 placed buy orders.
This logic requires so detailed and delicate consideration that there is a downside that trades have to watch the chart more closely than the after-mentioned pattern. But it can lessen the width of loss.
<Pattern 2>
This logic allows traders to take an adventurous approach as, unlike Pattern 1, there is no need to make a delicate consideration.
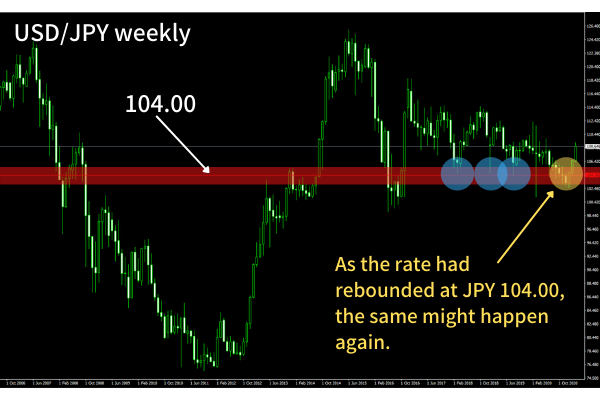
・The USD/JPY weekly chart showed the multiple-time rebounds at the level of JPY 104.00. On the basis of it, the trader started to prepare for the buy entry.
・The trader set a loss-cut line at the deeper level than usual (up to around 300 pips below the entry line). And in preparation for a loss cut, the trader decided to accept the loss of up to 2% of the invested money and adjusted the position size accordingly.
・The trader made a buy entry when the rate reached the level of JPY 104.00.
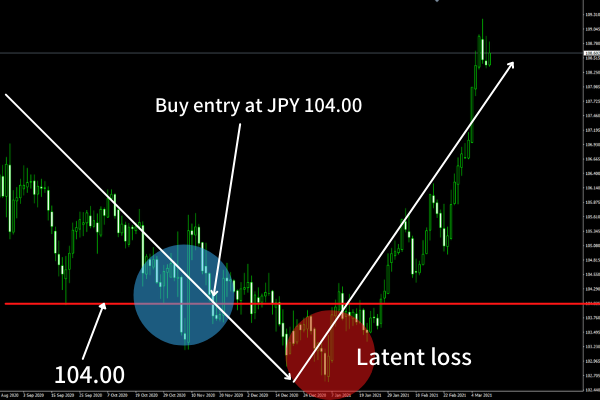
Why this pattern is better than the previous pattern is that traders are allowed to focus on whether the market rebounds at the support line or not. So you can make a buy entry as long as you preliminarily set the buy order at the level of the support line.
However, you should focus on portfolio management. The support line identifiable on a weekly chart often shows a large size “overrun” and you may be forced to hold a latent loss as the market falls far below JPY 104.00. To prevent such a case, you should set the loss-cut line at the deeper level than usual in order to limit the loss up to 2% of the invested money. It is because unsuccessful trade is inevitable.
As shown above, there are various trading approaches if traders use the same chart. This is an appeal of FX trading.
It is uncommon to use the support line on a weekly chart for trading. In this case, the trader believed in the functionality of the line on a wider time-window chart. I think many traders might take a similar approach at this time.
This is the end of the introduction of a horizontal line.
The way to draw a line varies between trades since they put stress on highs, lows or necklines. I would like you to find a line suitable to you and its usage through the trading and validation.
