Granville's Law uses the divergence or convergence between the moving average and the rate to determine the entry point. Please note that this law does not clearly tell us the entry point. However, it gives us an important factor to understand the current rate from a long-term and short-term perspective. In addition, it can be used to verbalize the current state of the rate in relation to the moving average when you want to conduct the trades such as “I will enter the market by following the direction of longer time-frame trend and waiting for the best moment with the shorter time frame" or "I will wait for a short term reversal to enter the market, despite the opposite direction to the longer time-frame trend". This article explains what Granville's Law is and how to utilize it for your actual investment.
Contents
Summary of Granville's Law
Advocate
Granville’s Law was advocated by financial analyst Joseph Ensign Granville (1923/8/20-2013/9/7)
What is Granville's Law?
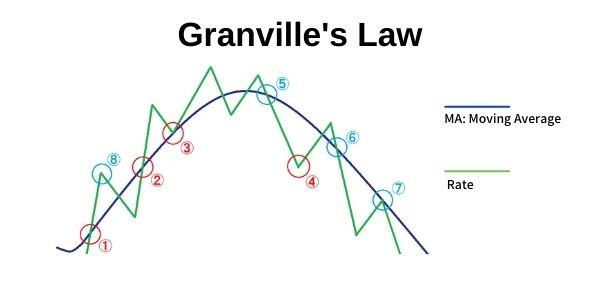
Buying entry point
①When MA begins to turn upward and the rate crosses above it.
(→ Determining the beginning of uptrend at a low level)
②When MA is upward and the rate crosses above it after the dip.
③When MA is upward and the falling rate rebounds on it.
(→ In an uptrend, it is possible to enter the market to ride on the influx of new buy orders)
④When MA is downward and the rate is diverted from it.
(→ Aiming at the rate’s convergence with MA amid the downtrend)
Selling entry point
⑤When MA begins to turn downward and the rate crosses below it.
(→ Determining the beginning of a downtrend at a high level)
⑥When MA is downward and the rate crosses below it after the reversal.
⑦When MA is downward and the rebounding rate is reversed on it.
(→ In a downtrend, it is possible to enter the market by riding on the influx of new sell orders)
⑧When MA is upward and the rate is diverted from it.
(→ Aiming at the rate’s convergence with MA amid the uptrend)
Please see also.
【Simple Moving Average (SMA)】 A method of technical analysis in FX trading
Cases 1 through 4 represent buying entry points, and 5 through 8 represent selling entry points, respectively. The rate repeatedly diverges from and converges with the moving average. You should target the divergence at cases 1 through 3 and 5 through 7, and convergence at cases 4 and 8. When you look at a chart, please have a standpoint of whether you should target the convergence or divergence based on the positional relationship between MA and the rate. And it will help you comprehend the price movements.
Use multiple time-frame charts to confirm the rate
It is important to have the ability to use multiple time-frame charts in order to increase the accuracy of trades. It is often said that the market has a “fractal structure”. So, we first take a look at what “fractal structure” is.
Imagine the market as the fractal structure
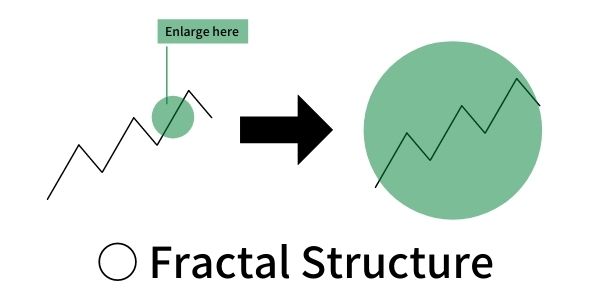
First of all, “fractal structure” is the structure in which an enlarged diagram looks similar to the original one.
In the example of a jagged line shown below, if you enlarge a part of the line, you will eventually see a straight line. This is not a fractal structure.
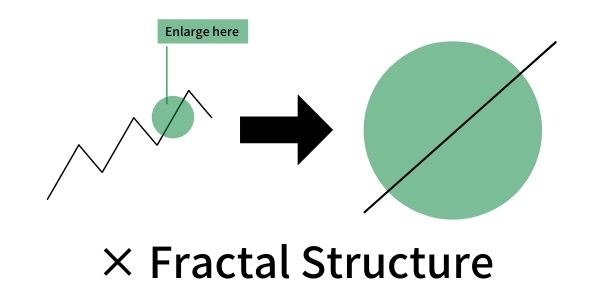
To be called “fractal structure”, the enlarged part of the diagram should resemble the shape of its entire diagram.
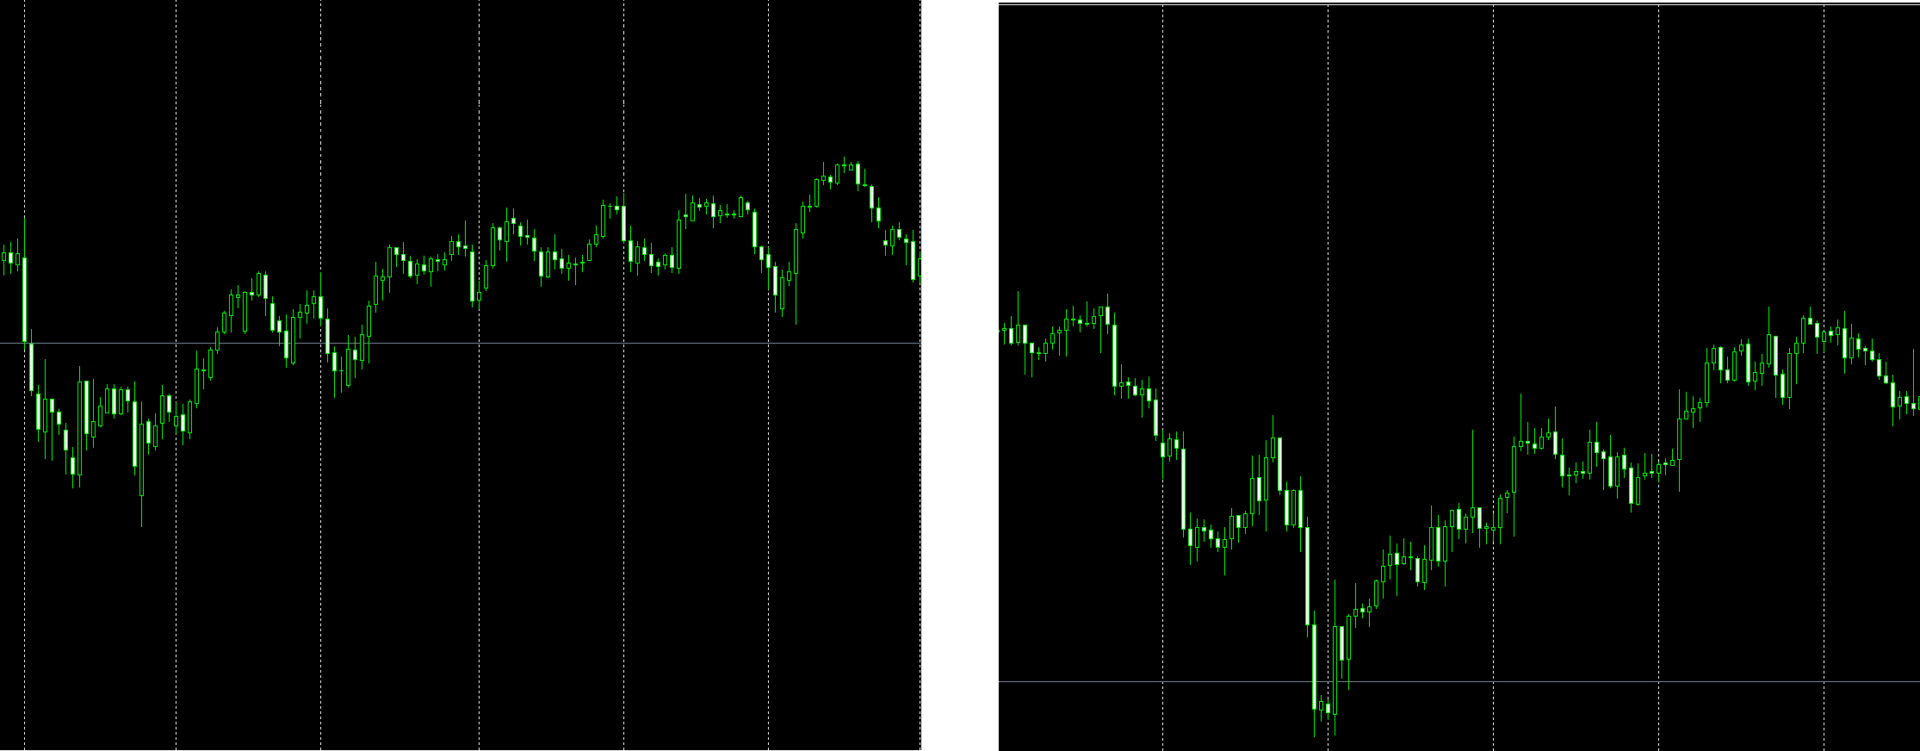
The above figures show the daily chart (left) and the hourly chart (right) of USD/JPY. If the market does not have a fractal structure, the hourly chart, the enlarged version of the daily chart, would look like a smooth straight line. However, there is no difference between the appearances of both charts. It holds true if you compare either of them with a 15-minute chart. The chart (or the market) has a complex shape regardless of its time frame. That is why the market is said to have a fractal structure. It leads to the conclusion that it is necessary to analyze each of the long-term and short-term charts separately and have the long-term and short-term perspectives.
How to utilize Granville's Law
How Granville's Law works in practical investment?
Granville's Law can work in practice in the following cases:
①You can recognize whether the rate you are looking at is uptrend or downtrend on the basis of 15-minute time frame and hourly time frame.
②By checking whether your entry point is in line with Granville's Law, you can avoid “the entry with a lower winning-rate" where you are out of sync with other market players.
If you hold a position in the same direction as other players do, you will be able to make a profit as the rate extends in that direction.
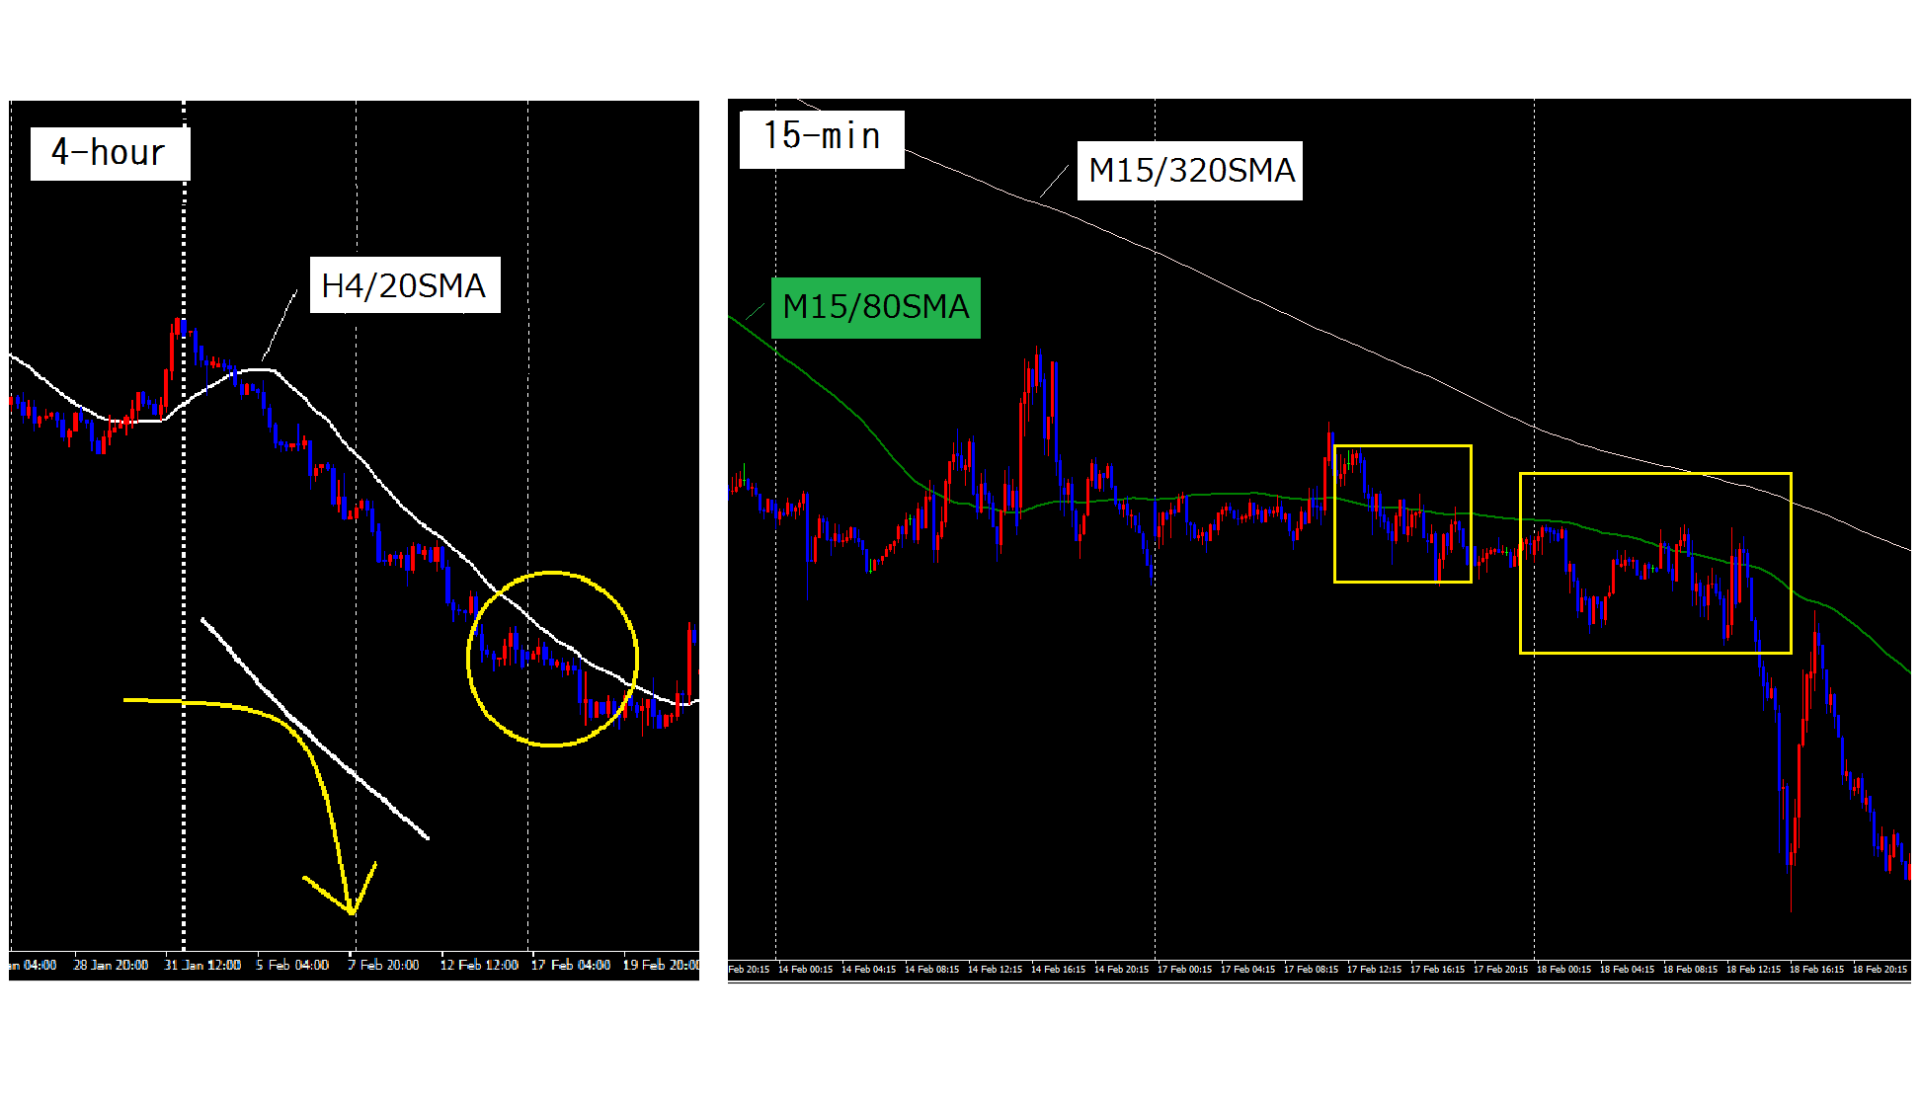
In this section, I will explain how to utilize Granville's Law with an actual chart. The figure below shows the 4-hour and 15-minute charts of EUR/USD on a given day.
※Chart settings
Left: 4-hour chart
(White: H4/20 SMA)
Right: 15-minute chart
(White: M15/320 SMA)
* 320 SMA on a 15-minute chart is equivalent to 20 SMA on a 4-hour chart.
(Green: M15/80 SMA)
* 80 SMA on a 15-minute chart is equivalent to 20 SMA on an hourly chart.
When you look at the 4-hour chart, the rate is falling in reaction to the downward 20 SMA, as highlighted by the yellow circle. When we take an in-depth look at this downward reversal with the 15-minute chart as highlighted in the squares, you can see that the rate fell after being suppressed multiple times by the 80 SMA.
While the 4-hour chart shows that the rate simply fell against the 20 SMA, the 15-minute chart shows that the rate had moved sideways for several hours and then pulled back in accordance with the downward of SMA. This reversal shown in the 4-hour chart corresponds to the case 7 of the above-mentioned explanation "when MA is downward and the rate is reversed on it”. Meanwhile, the 15-minute chart shows multiple occurrences of cases 5, 6, and 7.
In this article, I am using a completed chart for explanation. However, it is needless to say that you will actually look at the chart without knowing the future price movement. When you try to understand it with multiple time-frame charts, you may be interrupted with various information which may cloud the accuracy of your analysis. However, the way of thinking is not different from the one introduced above. Those familiar with Granville's Law will recognize that "The 4-hour 20 SMA is downward and the trend of 1-hour 20SMA is about to change from sideways to downward. So let's look for a short-position entry point on the 15-minute time frame”. As such traders understand this law, they can do away with the idea of when to conduct a buying entry from their consideration.
If you understand Granville's Law like this, you will be able to verbalize the price movement on the charts. And if you can have this perspective, you will be able to get out of the perpetual beginner.
In the world of FX trading, you can succeed by taking positions in the same direction as other market players; some players trade on the 4-hour time frame, others on the 15-minute time frame. If you can use the respective time frames to determine the upward or downward trend, your trading performance will improve. I hope you will make use of Granville's Law when you look at the charts.
