The purpose of this article is to verify with an automated trading program (EA) and a strategy tester how effective it is to use the golden cross and the dead cross of simple moving average (SMA) to decide to take or close the position.
I am currently planning to create a trading logic using SMAs. I used a strategy tester to verify the golden cross/dead cross logic in the process. This article introduces its result.
NOTE: The trading logic which focuses on the golden cross and the dead cross varies between traders. It is common to use some kind of filter or some logic in addition to this technical chart pattern. This article first discusses the profitability when taking or closing positions only in reference to the crosses and the verification result of whether the addition of a filter can improve performance.
It would be nice if this article is helpful to those who want to know whether the trading logic using SMA crosses can bring success.
[Summary of This Article].
- The trading logic which solely focuses on SMAs is not effective.
- The trading logic of taking a long position at the point of golden cross and a short position at the point of dead cross works as long as the market goes in a particular direction (trend market).
- Applying the filter based on the divergence of short-, middle-, and long-term SMAs can improve the performance in spite of the room for further improvement.
If you are interested in a trading method using SMAs, please refer to the below;
Related Article: [Trading Logic Using Moving Averages] Why I Have Been Successful in Forex Trading.
If you want to learn about SMA, please refer to the below;
Related Article: [Simple Moving Average (SMA)] A method of technical analysis in forex trading
If you want to make practical use of SMA, please refer to the below;
Related Article: [Granville's Law] The Application of Moving Averages
Contents
What Are "Golden Cross" and "Dead Cross"?
“Golden cross” is the technical chart pattern that a short-term SMA crosses above a long-term SMA.
“Dead cross,” in contrast, means that a short-term SMA crosses below a long-term SMA.
Chart Settings (Platform: MT4)
EUR/USD 15-minute chart
Short-term SMA: 20-period
Long-term SMA: 80-period
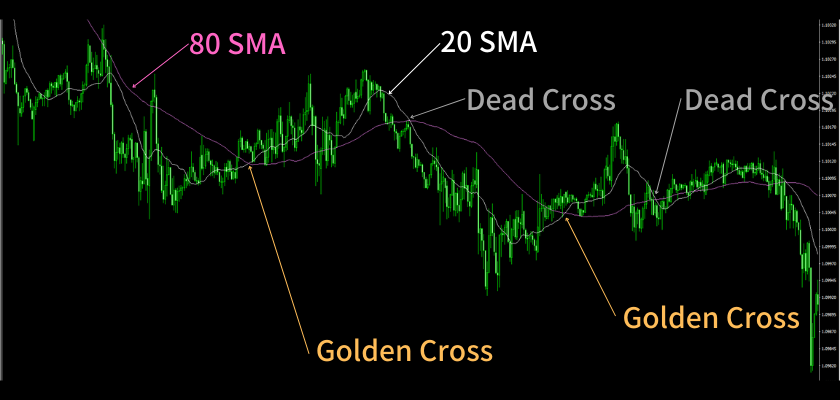
This verification was conducted on HotForex’s MT4 trading platform.
For details of this platform, please refer to the below site; [HotForex official website].
This site only introduces brokers with a financial license and a well-developed security system. We have prepared a page that summarizes the best brokers by the trader's country of residence [click here]. On this site, any trades are conducted through the brokers listed on this page and with MT4.
Verification
Verification (1): Take or Close Positions by Focusing on Golden Cross and Dead Cross
Details:
- Currency Pair: EUR/USD
- Time Frame: 15 minutes
- Period: January 1, 2021 - December 31, 2021
- Short-term SMA: 20-period
- Long term SMA: 80-period
- Set Spread: 0.2 pips (2.0 points)
- Entry Logic
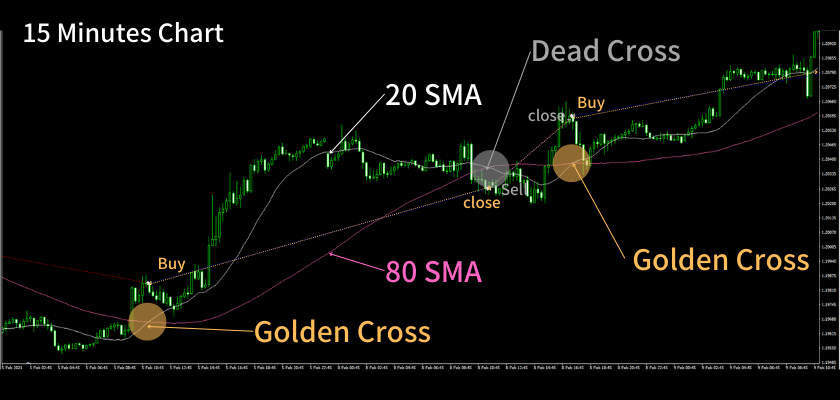
- Take a long position when a golden cross appears and close it when a dead cross appears
- Take a short position when a dead cross appears and close it when a golden cross appears
※Why I select 20-period and 80-period SMAs
Many traders focus on a 20-period SMA of each time frame. Here, I specified 20-period SMA of the 15-minute chart as a short-term SMA and 20-period SMA of the hourly chart (equivalent to 80-period SMA of the 15-minute chart) as a long-term SMA so that I can check the technical chart pattern on the same chart.
Tester Report
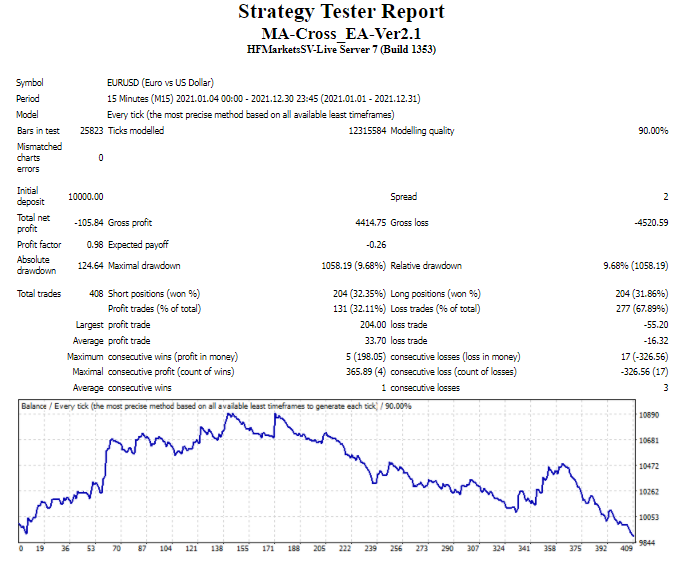
Strategy Tester: HotForex (Official Site)
Result
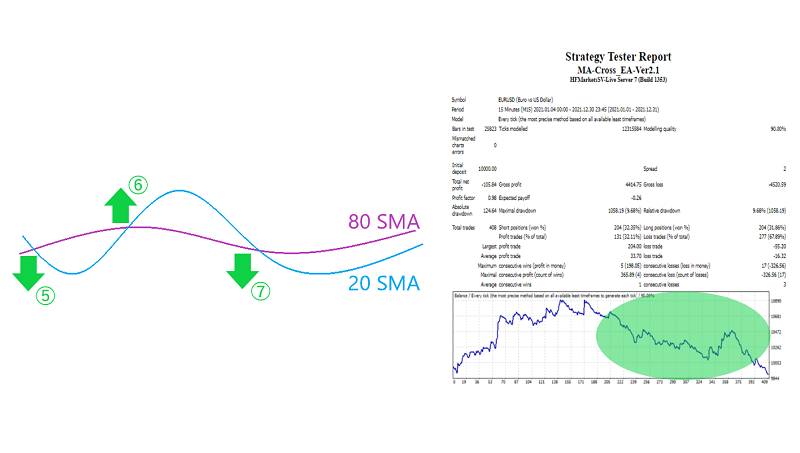
- A total of 408 trades were conducted in 2021.
- The largest profit trade of this logic was 204 pips. It yielded better performance in terms of the FX trade based on a 15-minute timeframe.
- Maximal consecutive wins were 5, generating a profit of 198.05 pips, while maximal consecutive losses were 17, causing a loss of 326.56 pips.
- There was a series of winning streaks in the first half of 2021, generating a profit of about 900 pips. But it ended with a loss of 105.84 pips.
Discussion
- The number of trades during one year (408) was average for the method of short-term trades.
- The net loss (- 105.84 pips) was much smaller than expected.
- Why the losing streak outnumbered the winning streak is attributed to the market environment as the period of the range-bound market was longer than that of the trend market.
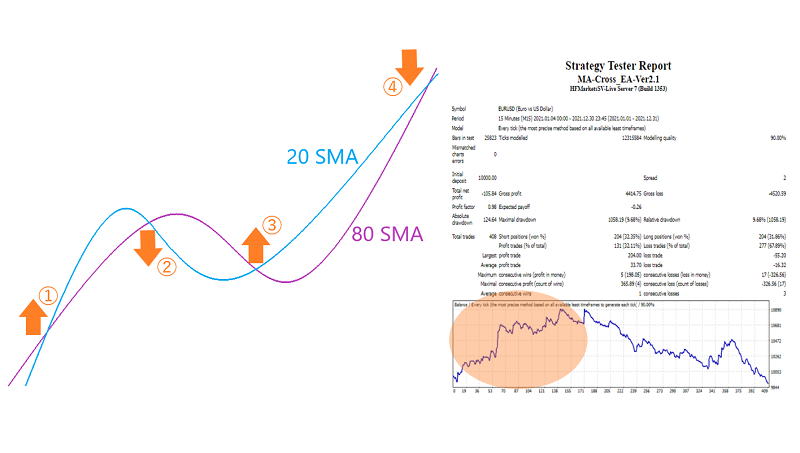
- As long as the crossing patterns of SMAs coincide with the price movement, this logic works well (see below Example 1).
- However, once the trend is finished, the market enters the range-bound phase, ending with a long-term losing streak (see below Example 2).
[Example 1]
- This logic took a long position at the point of the golden cross (①and ③ of the below figure) and closed it at the point of the subsequent dead cross (② and ④).
- This logic took a short position at the point of the dead cross (②) and closed it at the point of the subsequent golden cross (③).
In the first half of 2021, as the trend which matched SMA’s crossing patterns occurred (highlighted in orange), this logic generated profit.
[Example 2]
- This logic took a short position at the point of the dead cross (⑤ and ⑦) and closed it at the point of the subsequent golden cross (⑥).
- This logic took a long position at the point of the golden cross (⑥) and closed it at the point of the subsequent dead cross (⑦).
In the second half, the market entered the range-bound phase, forcing it to repeat entries and loss cuts (highlighted in green). Thus, this logic failed to work.
Verification (2): Apply Divergence/Convergence Filter
What Are Convergence and Divergence of SMAs?
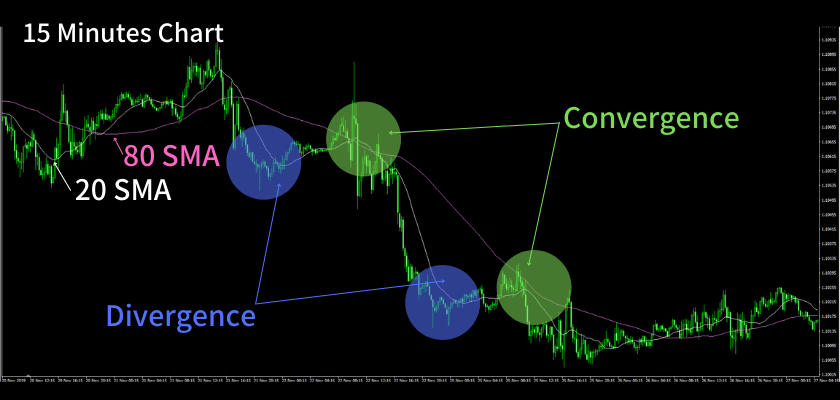
Two SMAs with different time frames are repeatedly moving in a converging and diverging manner. The figure below shows the convergence and divergence of 20-period and 80-period SMAs on the 15-minute chart.
Related Article: [Granville's Law] The Application of Moving Averages
Here, I applied a filter that focuses on the pattern of convergence and divergence.
Details
Currency Pair: EUR/USD
Time Frame: 15 minutes
Period: January 1, 2021 - December 31, 2021
Short-term SMA: 20-period
Middle-term SMA: 80-period
Long-term SMA: 320-period
Set Spread: 0.2 pips (2.0 points)
Entry Logic
- Take a long position when a golden cross appears and close it when a dead cross appears.
- Take a short position when a dead cross appears and close it when a golden cross appears.
Filter
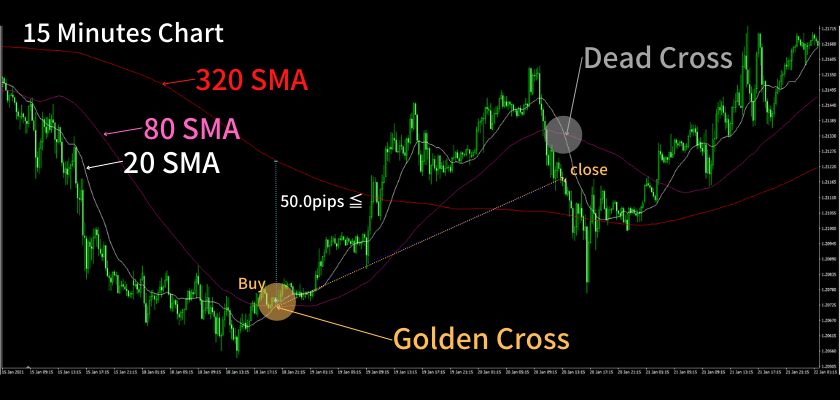
- Take a short position when the width (divergence) between the 320-period SMA and the dead cross point of the 20-period and the 80-period SMAs becomes or exceeds 50 pips.
- Take a long position when the width (divergence) between the 320-period SMA and the golden cross point of the 20-period and the 80-period SMAs becomes or exceeds 50 pips.
Here, I applied to the logic of Verification (1) the filter which enables me to decide to take a long or short position when the width (divergence) between the crossing point of the 20-period and the 80-period SMAs and the 320-period SMA exceeds 50 pips, expecting the rate’s convergence with the 320-period SMA.
[How to Decide to Take or Not Take a Position]
<When 20-period and 80-period SMAs are running above the long-term SMA>
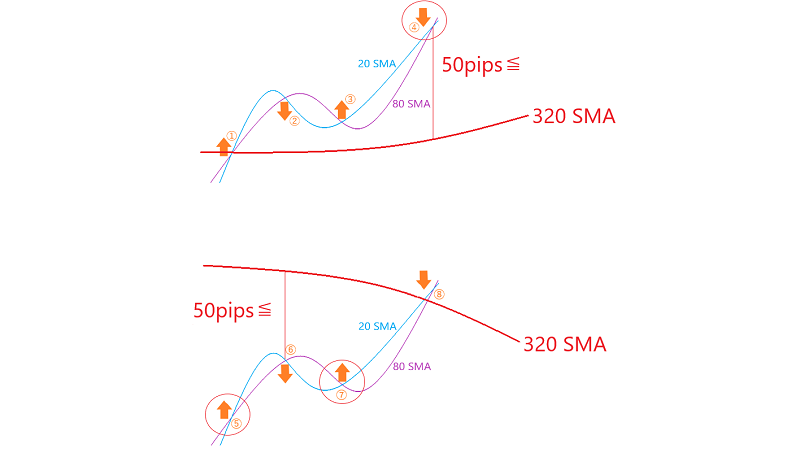
- When the width between the 320-period SMA and the points of the golden crosses of 20-period and 80-period SMAs (① and ③ of the below figure) and the dead cross of them (②) is below 50 pips, it is wise to refrain from taking any positions.
- As the width between the SMA and the point of the dead cross (④) exceeded 50 pips, it can be recognized as a sign to take a short position as the rate is expected to converge with the 320-period SMA.
<When 20-period and 80-period SMAs are (mainly) running below the long-term SMA>
- As the width between the 320-period SMA and the points of the golden crosses (⑤ and ⑦ of the below figure) exceeds 50 pips, it can be recognized as a sign to take a long position as the rate is expected to converge with the 320-period SMA.
- The width between the SMA and the points of the dead crosses (⑥) exceeds 50 pips. However, if a short position is taken here, it contradicts the condition of aiming at the rate’s convergence with the 320-period SMA. So, it is wise to refrain from it.
- When 20-period and 80-period SMAs cross above the 320 SMA and then the width between the dead cross point and the 320 SMA is less than 50 pips (⑧), it is wise to refrain from taking any positions.
Tester Report
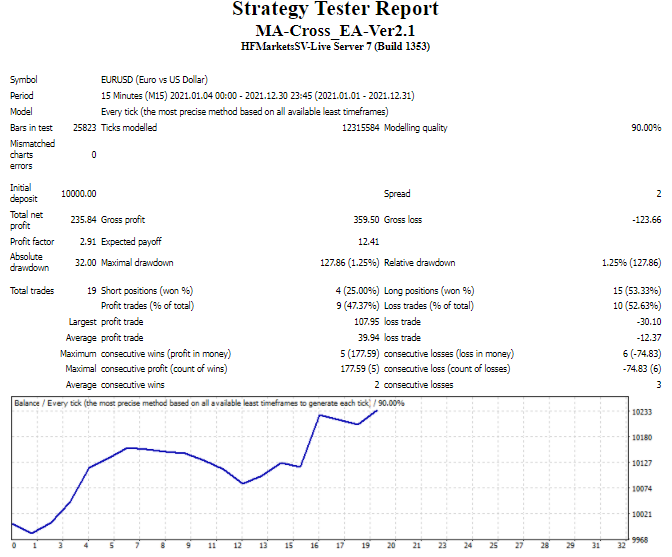
Strategy Tester: HotForex (Official Site)
Result
- Only 19 trades were conducted during one year, hugely decreasing from the previous verification.
- The performance improved to + 235.48 pips from - 105.84 pips of the previous verification.
Discussion
- I applied the above filter but used the same entry logic as I did on Verification (1). Nevertheless, the performance surprisingly improved.
- Many successful traders who use SMA for discretionary trading SMA would follow the trading logic similar to the above.
Verification (3): Expand The Period
Since there was an upturn in performance in Verification (2), I re-verified the performance by changing the period to five years spanning from January 1, 2016, to December 31, 2020. The other configurations were left unchanged from the previous verification.
Tester Report
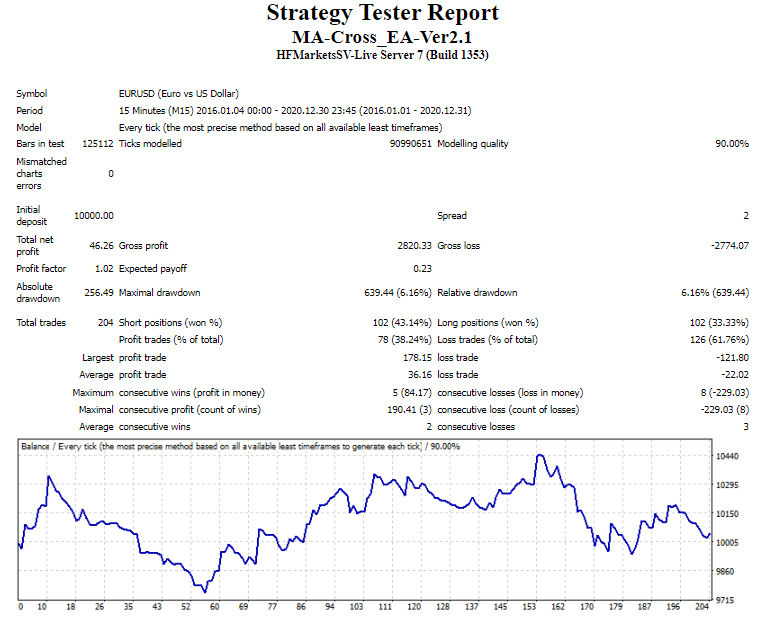
Strategy Tester: HotForex (Official Site)
Result
- A total of 204 trades were conducted during five years.
- Although this logic generated a profit of 440 pips at one point, two large drawdowns wiped out the profit in the end.
Discussion
- Unlike in 2021, this logic did not work well when being applied to the market of 2016-2020.
Discussion throughout Verifications
Although the logic used on Verification (2) generated good performance, it resulted in poor performance after expanding the period. However, it is not something to be pessimistic about.
- Any trading logic in the verification phase usually starts with this level of performance.
- Thanks to its simplicity, this logic is suitable for and adjustable to actual trading without difficulty.
- It would be possible to improve the performance if the drawback issue found on Verification (3) can be solved.
Summary
- The trading logic which solely focuses on SMAs is not effective.
- The trading logic of taking a long position at the point of golden cross and a short position at the point of dead cross works as long as the market goes in a particular direction (trend market).
- Applying the filter based on the divergence of short-, middle-, and long-term SMAs can improve the performance in spite of the room for further improvement.
[Further Examination]
I will examine the price movement patterns during the drawdown period and look for a filter that can help avoid the entry during that period but can still hold the winning trades.
Conclusion
I basically use a strategy tester to fully verify my developed trading logic so that I can determine the performance beforehand. However, I also exercise my discretion for the actual trading. Therefore, I do back testing with a tester and manual calculation.
“Exercising my discretion” does not mean that I play my hunch like “Let's take a short position next time as I've lost money by taking long positions”. I choose to "refrain from trading" when important indicators or economic news which may generate a huge impact come out.
Exercising my discretion = Taking a pass on trades for risk aversion
It is important that discretion should be exercised in order to reduce the possibility of unnecessary losses, not to look for profit.
This article introduces my verification result of how effective it is to use the golden cross and the dead cross of SMAs. As there is room for improvement, I will update you after the revision.
Please note that I will not make public the completed logic applicable to the actual trading without charge. Instead, I am willing to make clear the developing process. It would be nice if this article would be helpful to you.
Thank you for sparing your time for reading this article.

