Elliott Wave is, so to speak, an evolved version of the Dow Theory, and a very important factor in chart analysis. To come right to the point, the most important thing to learn about Elliott Wave is the concept of "Follow Wave 3”. In the market, the third wave is likely to have the strongest momentum, and successful traders tend to continue to approach it in an unhurried manner. This article introduces how to count waves, why the third wave extends, and how to use it for trading.
Contents
Elliott Wave Overview
①Proponent
Ralph Nelson Elliott (1871-1948)
②Principles
Principle #1
In the case of uptrend, the ending point of Impulse Wave 2 should not fall below the starting point of Wave 1.
Principle #2
Wave 3 shall not be the "shortest wave" compared to Wave 1 and Wave 5.
Principle #3
In the case of uptrend, the ending point of Wave 4 should not fall below the one of Wave 1.
Principles #1 and #3 can be reversed in the case of a downtrend. An overview of Elliott Wave including the above principles will be explained below.
Overview (How to count waves and characteristics of each wave)
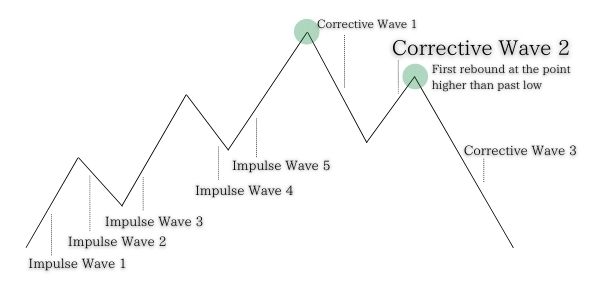
Elliott Wave can be briefly summarized as the idea that “In the rally market, there are five upward waves, and then three downward waves follow. These waves form one cycle.” First of all, I will explain the "five impulse waves and three corrective waves" in Elliott Wave, using the figure below.
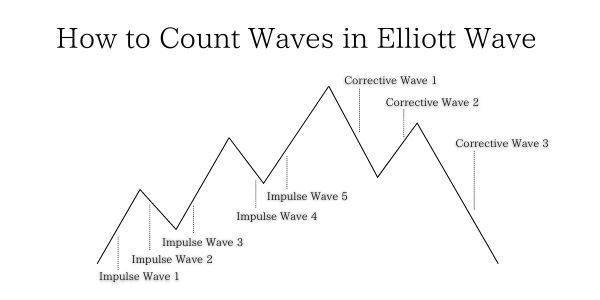
As shown in the figure above, Elliott Wave consists of "five impulse waves and three corrective waves". Especially, Wave 3 and Wave 5 are likely to be extended and climb higher. However, it takes getting used to seeing the waves. Those who are not familiar with this theory may not be able to distinguish Wave 1 and Wave 3. For this reason, I will explain the characteristics of each wave and the definition of each wave.
Impulse Wave 1
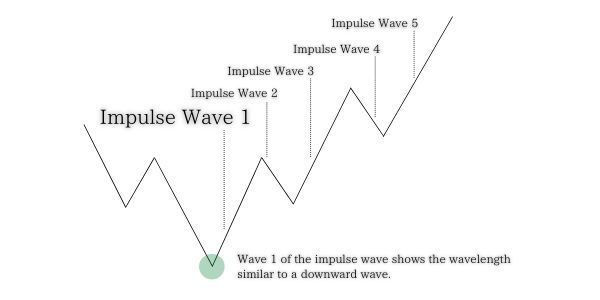
Although the downtrend has come to an end, it is still difficult to predict at this point whether or how long the uptrend will continue in the future. In some cases, there are many remaining sell orders of the traders who have anticipated the continuation of downtrend. It may make this sub-wave short-lived without significant growth. As this first upward sub-wave looks like a corrective wave, it is difficult to determine that it is in the process of forming the first sub-wave of the impulse wave. It is not until Impulse Wave 3 is formed when you will be able to recognize Wave 1 has been formed.
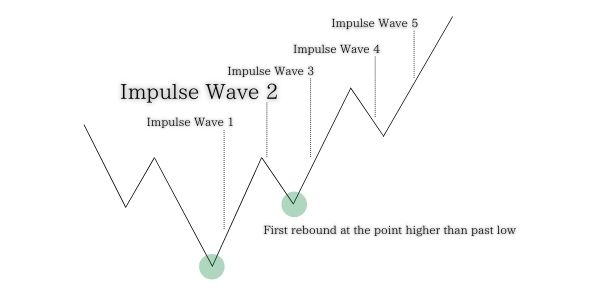
Impulse Wave 2
If Wave 2 falls below the starting point of Wave 1, it is confirmed that the downtrend continues. Only when the downward Wave 2 shows the rebound at the point higher than the starting point of the previous wave, Impulse Wave follows. Therefore, during the period of Wave 2, it is effective to determine its end based on several factors and prepare for the upcoming upward sub-wave, rather than paying attention to the price movement for trading in the period.
Impulse Wave 3
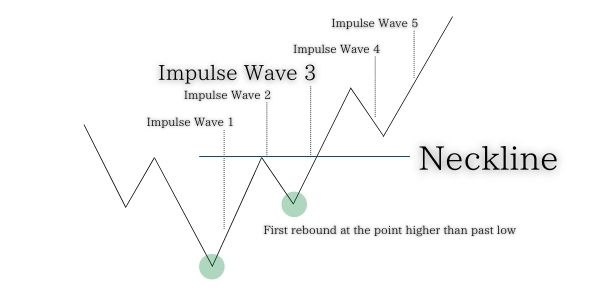
This sub-wave usually shows the most powerful upward momentum in the series of impulse waves. The chart shows the rebounds at the end of the second wave and then travels beyond the neckline (*), drawn from the ending point of Impulse Wave1 or the starting point of Impulse Wave 2. As traders who had held positions in the downtrend until then start to close their positions by profit-taking or loss-cut, the price further soars. This uptrend Wave 3 tends to be the most advancing in the series of impulse waves, due to the combination of position closing (buying order) of sellers who had supported the downtrend up to that point, and the buying orders of traders with an upward perspective who has just determined that the downtrend was over.
(*) Neckline: A line drawn horizontally from the starting point of the line which failed the attempt to fall below the previous low.
Impulse Wave 4
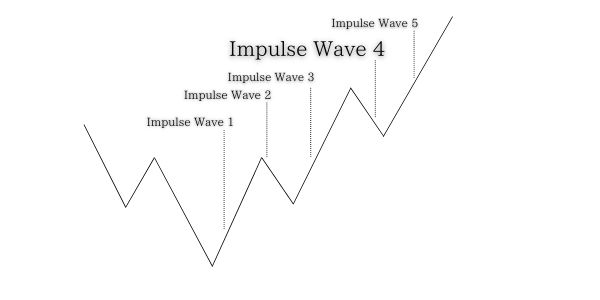
The price movement may become complicated by the mixture of settlement orders of traders, who have formed Wave 3, and buy orders of traders who expect the previous uptrend to continue further. In addition, it is a principle of Elliott Wave that the ending point of Wave 4 should not be lower than that of Wave 1. So any traders who consider to enter the market on Wave 5 need to determine the end of Wave 4. At that time, it is effective to check Wave 4 on the basis of a time frame shorter than the one you usually use for trading, similar to the method of determining the end of Wave 2 to enter Wave 3. By doing so, it is possible to recognize Wave 4 as downtrend and enter the market to ride the next uptrend.
Impulse Wave 5
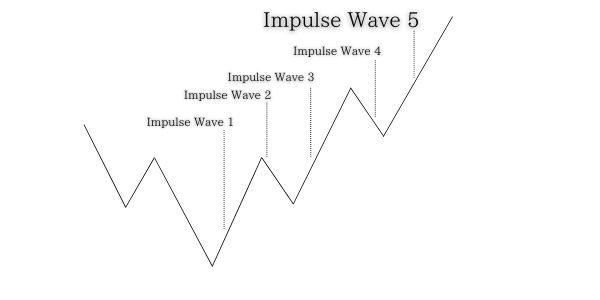
In many cases, the momentum of Wave 5 is not as powerful as that of Wave 3, and the upward momentum is reduced by traders who have formed Wave 3 and but start to sell for profit-taking, or by traders who expect the end of uptrend. Also, the smaller Wave 5 is, the more traders it is to switch their focus on the market from the uptrend to the downtrend. If you are targeting Wave 5, you need to keep in mind the risk that the uptrend that began in Wave 3 will be reversed for the downtrend.
Corrective Wave 1
The downtrend is likely to start due to the combination of two factors; Traders who had been supporting the previous uptrend start to sell for profits. And more and more traders start to hold selling positions. However, it is difficult to determine at this point whether this is the first wave of the corrective wave, and in many cases, it does not become clear until later whether a major reversal of Impulse Wave 5 has just happened, or the downward trend has just started. At the time of Corrective Wave 1, there is still a lack of factors to determine that the uptrend has completely ended. So it may be wise to forgo trading as there is a possibility that the price will switch to a downtrend.

Corrective Wave 2
The most important characteristic of Corrective Wave 2 is that it is the first time that the chart fails to break through the previous high, unlike the previous uptrend. If Impulse Waves 3 and 5 of impulse have already appeared, and Corrective Wave 1 is clearly visible, more traders would assume that the uptrend is over at this point. A wise trader would even decide at this point either to enter the market, aiming for the turnaround of this downward wave, and then place a sell order as the third downtrend wave comes, or wait and see the end of Corrective Wave 3 and then place a buy order in anticipation of the next Impulse Wave 3. Many traders seem to utilize this Wave 2 not to determine whether to enter the market, but to confirm its end and prepare for the upcoming downward wave.
Corrective Wave 3
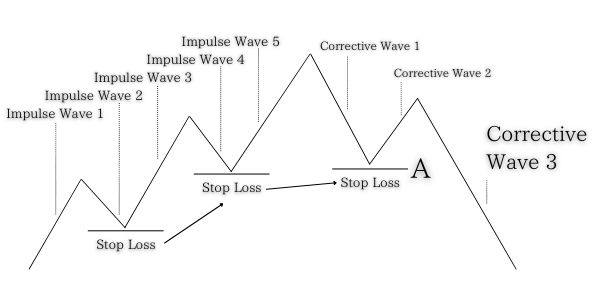
Corrective Wave 3 enables us to “make sure of” Corrective Wave 2, meaning that the once continuously succeeded breakthrough did not appear for the first time since the start of Impulse Wave 1. This confirmation can be further supported when the price falls below the line A in the above figure. Otherwise, the uptrend is still in progress. Traders who have supported the uptrend so far are observing whether or not Corrective Wave 2 breaks through the previous high (strictly speaking, it is not possible to determine whether it is Corrective Wave 2 or Impulse Wave 5 at this point). In many cases, the settlement lines of traders who have confirmed Corrective Wave 3 are concentrated at the position A. When the chart crosses below this line, the closing of buy entries, i.e. sell orders, accelerates at once. In addition, new sell orders are placed by traders with a selling perspective, and Corrective Wave 3 has the property of extending downward significantly. This principle is the same as that of an uptrend, where Impulse Wave 3 extends upward.
Elliott Wave: How to utilize it in trading
So far, I have explained the outline of Elliott Wave. Which wave to utilize varies from trader to trader, but the most successful way is to ride the third wave. So, what is the best way to "ride the third wave"? This section introduces how to ride the third wave.
What you need to do to ride the third wave of Elliott Wave
For example, you are trading on the 15-minute time frame and focusing on the upcoming Impulse Wave 3 in anticipation that the downward trend ends and an uptrend follows (see the figure below). However, depending on the event which may happen at the end of Impulse Wave 2, you do not determine if the wave you are targeting will grow significantly as expected (A) or if the uptrend will quickly be reversed and the price falls (B).
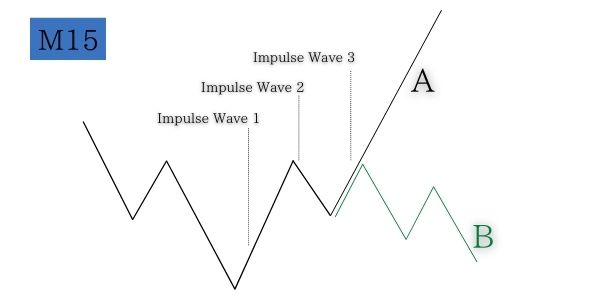
So, in what situation is the chart likely to extend upward as in A? The key is whether a chart of the longer time frame are in a position to easily extend upward. In other words, if you want to catch the trend change in the 15-minute time frame, it is important to check whether the rate is positioned in Wave 3 or Wave 5 on the 4-hour time frame as well.
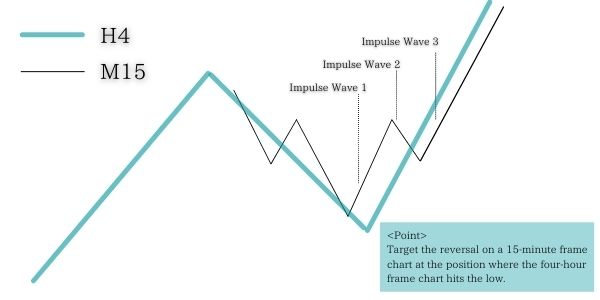
When the 4-hour time frame is hitting a low and the 15-minute time frame shows a reversal from a small downtrend, the intentions of traders who are looking to buy on the 4-hour time frame and those who are looking to buy on the 15-minute time frame coincide. In addition, this is also the time when traders with a selling perspective who formed a downtrend on the 15-minute time frame close their positions. So the buy orders overlap with the settlement orders of the selling positions.
(1) Buy entries by traders in anticipation of a trend reversal on the basis of 15-minute time frame
(2) Buy entries by traders who expects the uptrend on the basis of the 4-hour time frame
(3) Settlements of sell position (buy order) by traders who have determined the conclusion of downtrend on the basis of 15-minute time frame
When the above three intentions coincide, Impulse Wave 3 on the 15-minute time frame is likely to climb upward. In other words, it is important to use the chart of the longer time frame and observe whether it also shows the convergence of orders. In addition, we often hear that "Awareness of environment is important in FX trading”. To be aware of the environment of the market, it is important to observe "whether the longer time frame also shows order converge in the same direction".
Conclusion
To wrap up the introduction of Elliott Wave, here is a summarization of the main points necessary to utilize Elliott Wave.
・Wave 3 has the strongest momentum both upward and downward.
・In order to take advantage of Wave 3 on a currently-using trade chart, it is important to observe whether the longer time frame also shows order converge in the same direction.
・In the case of examining whether orders in the same direction are placed even on the longer time frame chart, if you are considering a buy entry, pay attention to the reversal of the short-term chart in the area “where the longer time frame chart shows the rebound at the point higher than the previous low". Likewise, if you are considering a sell entry, pay attention to the area “where the longer time frame chart fails to break through the previous high”.
Please try to be aware of Elliott Wave for chart analysis.
