ATR, an abbreviation of “Average True Range”, is an indicator of volatility, which generally represents the floating range of the market. The high volatility means the price swings up and down wildly while the low volatility means the opposite.
The appropriate volatility for trading differs between traders. But ATR provides the grounds for transactions; entry, profit taking, loss cut and so on. Also, some EA logics employ ATR as a filter, indicating that, for example, entry should be refrained if the price movement exceeds the certain range.
This article introduces the outline of ATR and how to utilize it for trading.
Summary of This Article
Outline of ATR
・ATR indicates the average floating range during the specified period.
・ATR is used as a measurement of volatility.
・It also supplements the grounds for other trade logics.
How to Utilize ATR
・ATR provides the grounds for making a decision for trading; entry, exit, or refraining from the entry.
Contents
Who Developed ATR?
Developer: J.Welles Wilder Jr., a technical analyst
Indicators used: ATR (Average True Range), RSI (Relative Strength Index), PIVOT etc.
Outline of ATR
・ATR indicates the average floating range during the specified period.
・ATR is used as a measurement of volatility.
・Many traders use ATR to calculate the future floating range and manage the portfolio.
・ATR also supplements the grounds for other trade logics.
High ATR = High volatility
Low ATR = Low volatility

CHART
Tradeview Official site→
HotForex Official site→
The above chart lays ATR (14) over the daily chart of USD/JPY. In this case, ATR is 0.5877, which is equivalent to 58.77 pips (JPY 0.5877).
How to Set ATR
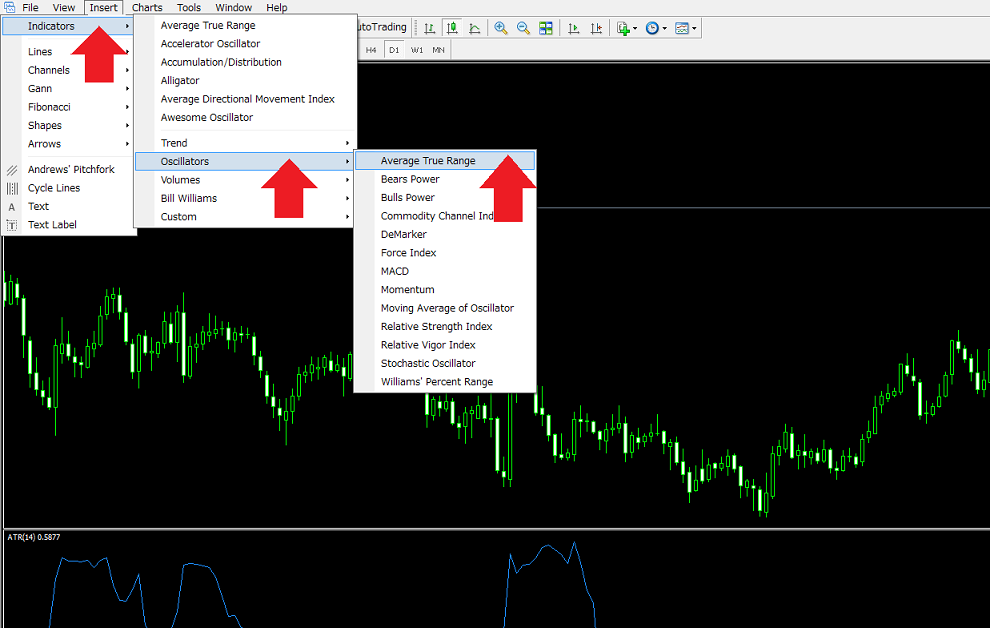
Insert > Indicators > Oscillators > Average True Range
How to Calculate ATR
Using Daily Candlestick Chart
The largest value of the below should be employed as True Range;
①Today’s high - Today’s low
②Today’s high - Previous day’s close
③Previous day’s close - Today’s low
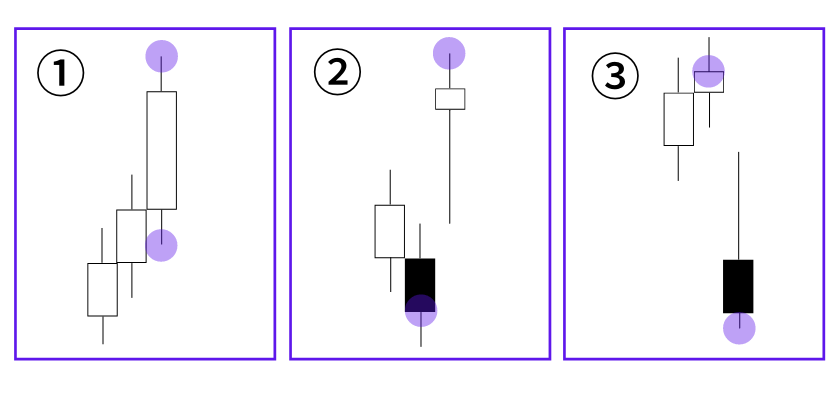
ATR can be calculated as an EMA (Exponential Moving Average) of True Range during n days.
・The period of EMA can be changed at “Parameters > Period”.
・Daily ATR is calculated with EMAs during the past n days, which means that candlestick daily charts of n days should be used. Likewise, to calculate hourly ATR during the past n hours, you should use the specified number of candlestick hourly charts to figure out EMAs.
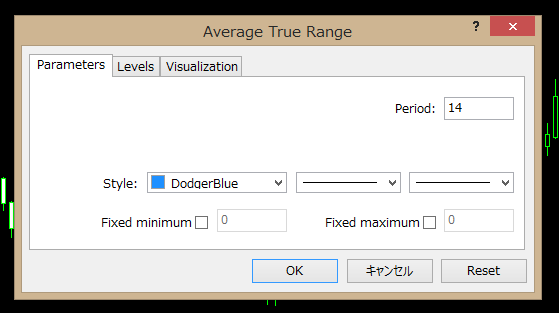
Parameters of ATR
Parameters
As J.Welles Wilder Jr., who developed ATR, recommends to use 14 candlesticks to calculate ATR, the default period is set as 14. Although the period can be changed, it is best to use the recommended value because many ATR users in the world do.
Please note that this average value is not calculated by making True Ranges consisting of 14 candlesticks even. In accordance with the formula of EMA, the more recent floating range is stressed over the older one. That is why ATR can reflect the recent fluctuation which enables to enhance the prediction accuracy.
How to Use ATR for Analysis
How to use ATR for analysis differs from the market environment. For example, when ATR is going up in the sideways market environment, it should be seen as a signal of trend occurrence. In this case, traders should follow the trend to earn profit. Meanwhile, if it is going down despite the occurrence of a trend, it should be seen that the current trend is about to end. In this case, many traders prefer a contrarian investment strategy.
How to Utilize ATR
Case 1: Detect the target for entry/exit
How to use ATR for entry
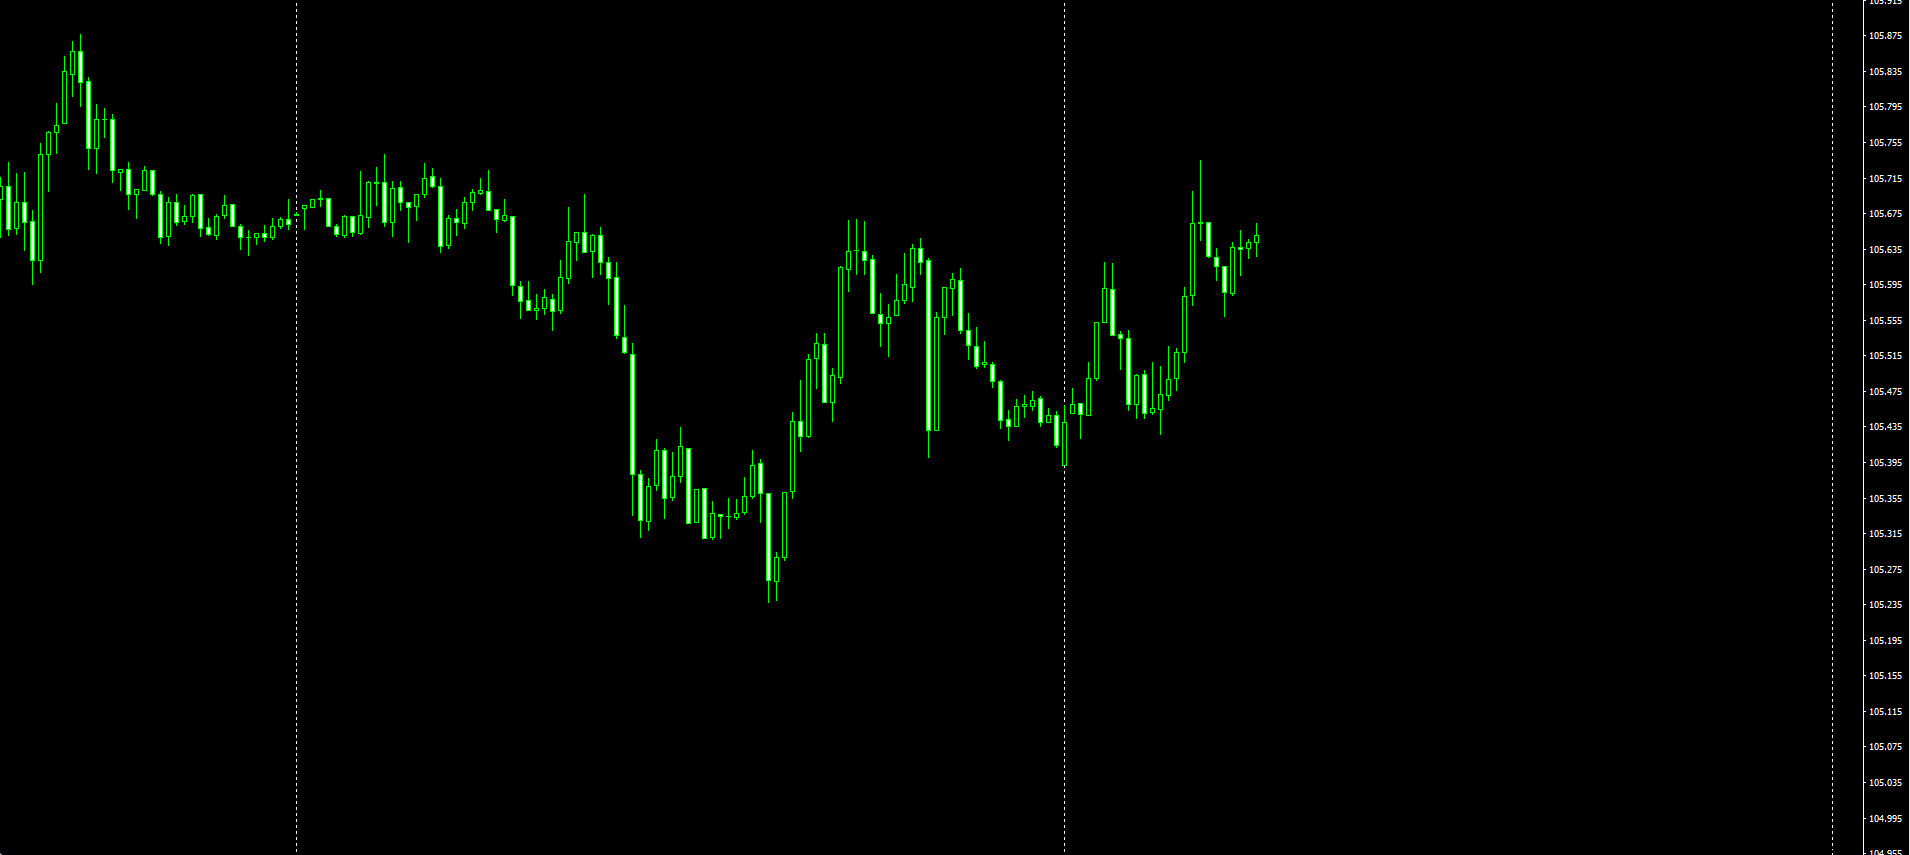
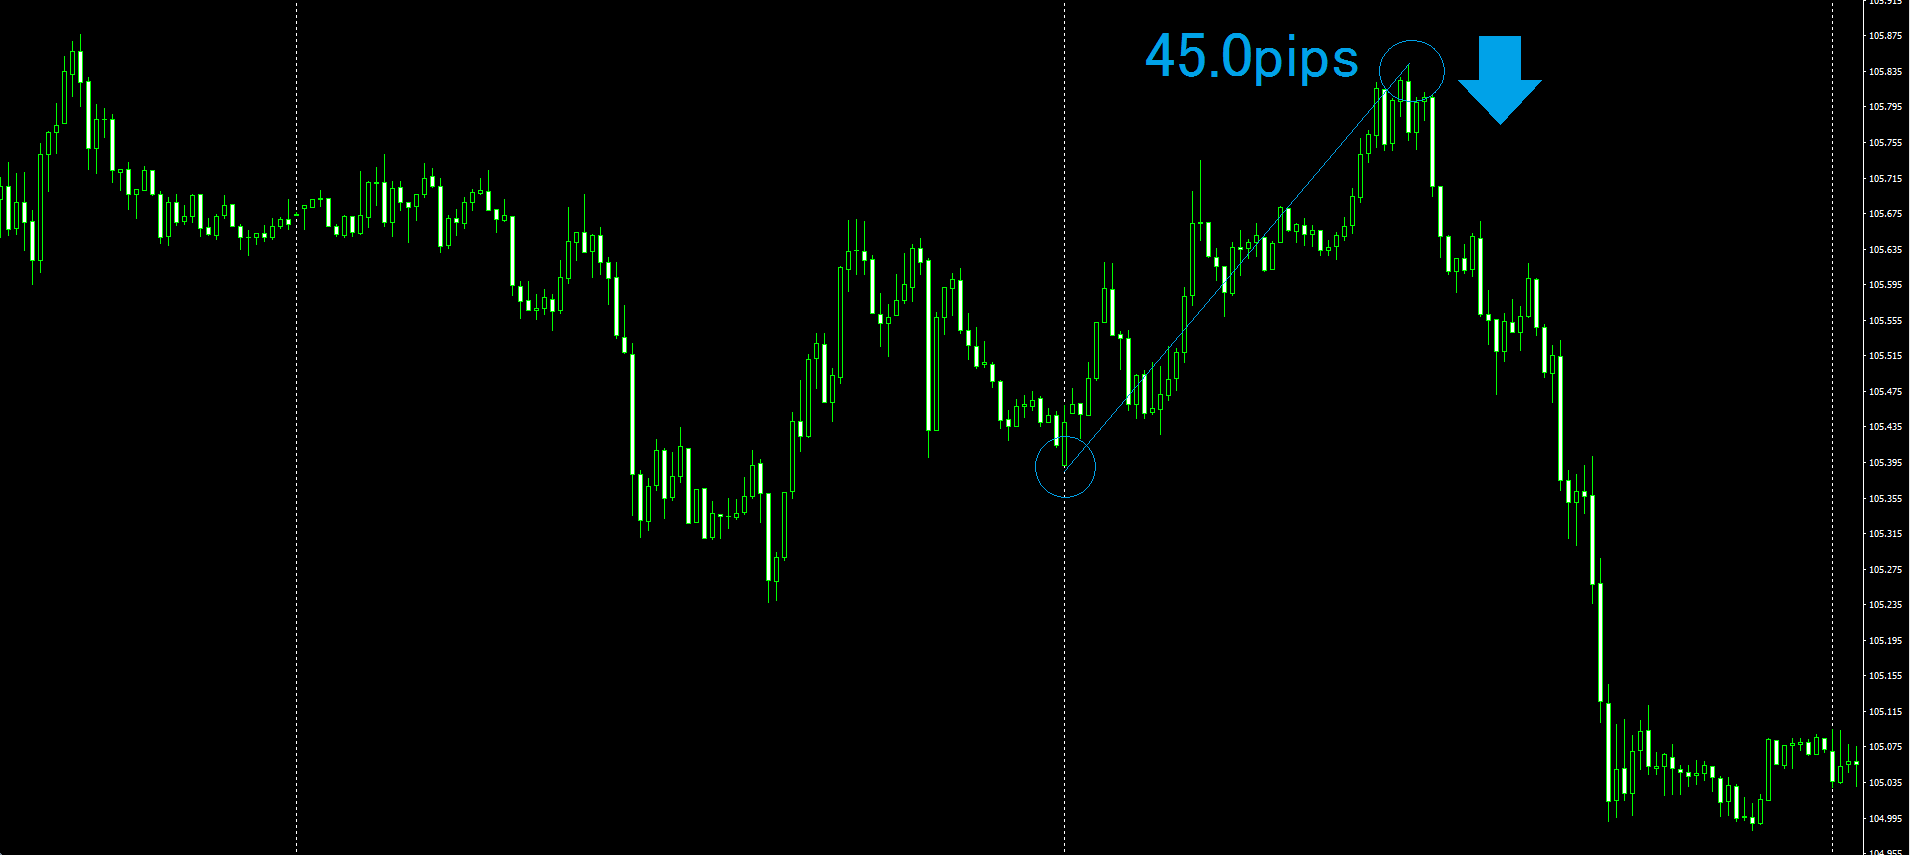
These charts explain how to utilize ATR to detect the timing of entry using a quarter-hourly chart of USD/JPY.
When a 14-period daily ATR indicates 45.0 pips (0.4500), traders can understand that the price has moved 45.0 pips from a daily average during the past 14 days. Many traders use the value to predict the floating range on a daily basis. It means that if the rate reaches the price calculated on the basis of the ATR value in the future, the market tends to show the reversal.
Sure, depending only on ATR gives the weak grounds for transactions. To be more successful in trading, traders should combine ATR with other elements such as a long-term support line.
How to use ATR for exit
Many traders set the profit-taking line on the position where the rate can achieve the range calculated on the basis of daily ATR. But the market does not necessarily follow ATR accurately. So, a profit-taking target should be set 20 or 30 % lower or higher than the calculated range.
Case 2: Refrain from the entry
How to use ATR to decide to make or refrain from the entry
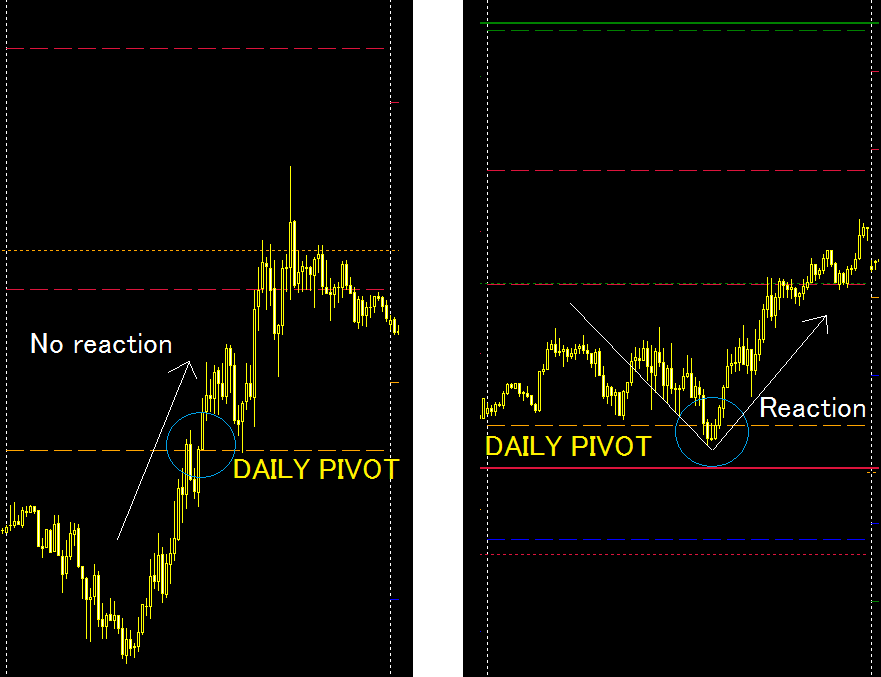
Left : Daily ATR (14)≒50.0 pips
Right: Daily ATR (14)≒25.0 pips
Indicator: Pivot
The above figures show the trend reversal over the daily pivot. Leading indicators such as pivot is very useful to many traders as they see the same line. But to strike out on a different path from other traders, it is important to have a higher percentage of successfully distinguishing the effectiveness of pivot. When ATR has a high value, in other words, in a highly volatile environment, the advantage of a pivot that many traders refer to the same line is weakened and the price does not tend to show the reversal.
ATR can be used to supplement pivot and other leading indicators.
【PIVOT】 How to Utilize Pivot for Technical Analysis
Conclusion
ATR uses the latest volatility to give an index for discretionary trading such as profit taking and loss cut. It also has functions to filter and to do transactions as an EA logic. On the technical analysis, it is important to detect the rate at which many traders consider the turning point. In this regard, ATR has an edge because many traders utilize it.
Thank you for sparing your time to read this article. I wish this article would be of help to you.
