MACD (Moving Average Convergence and Divergence) is an indicator to determine the trend by using fast (short-term) and slow (medium- to long-term) EMAs (Exponential Moving Average). MACD, which is displayed on the sub-window under the chart, is usually used to determine the trend with zero on its basis and the timing of entry based on the crossing of MACD lines and a signal line. This article introduces how to use MACD in the correct manner.
Contents:
How MACD is Displayed and Suggested Parameters on MT4
How to Watch MACD
How to Utilize MACD
Limitations of MACD and How to Solve Them
Contents
How MACD is Displayed and Suggested Parameters on MT4
How MACD is Displayed
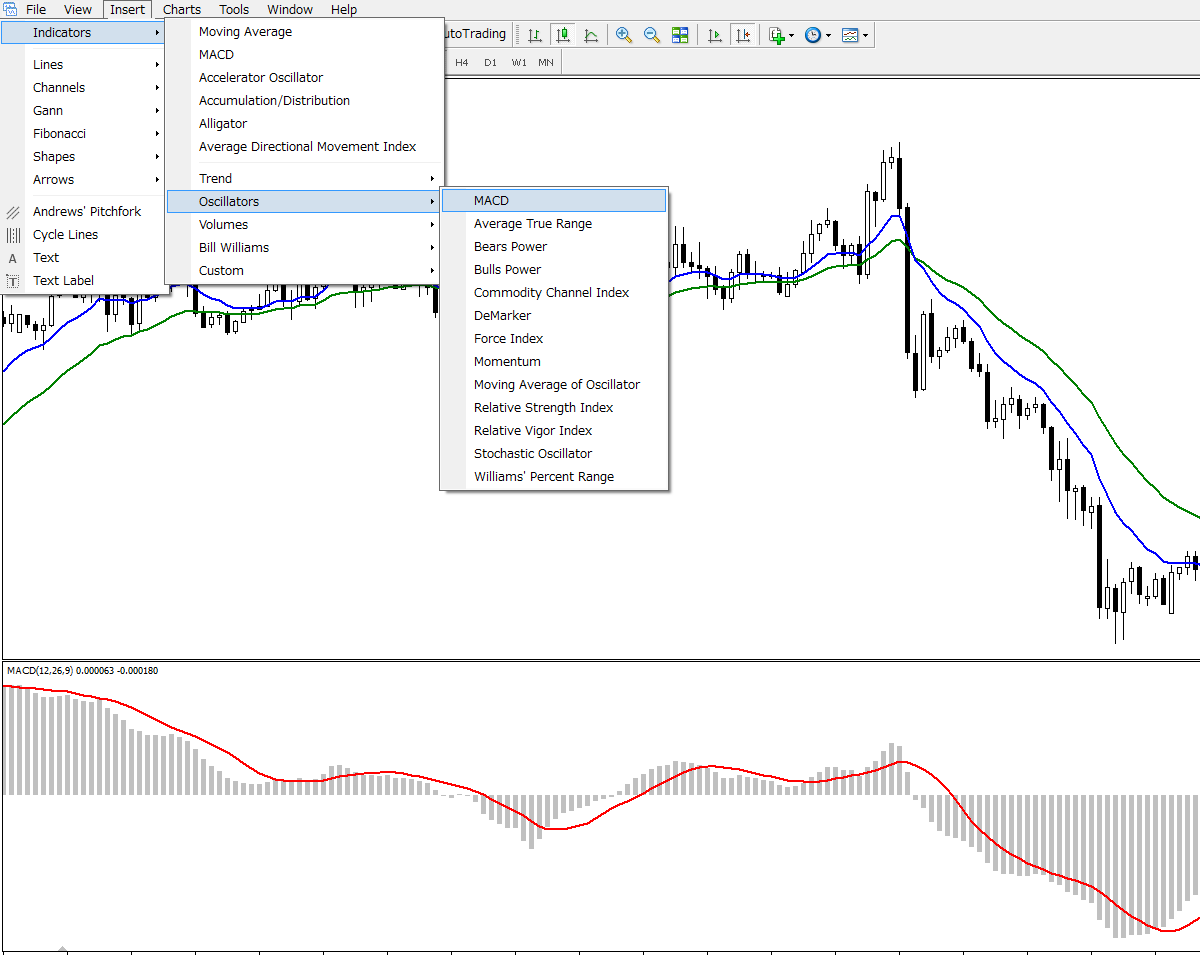
Chart
Tradeview: Innovative Liquidity Connector (ILC Account) MT4
On the MT4 chart, MACD can be displayed with the setting of Indicators > Oscillators > MACD.
[NOTE] The above chart shows EMAs necessary to calculate MACD. To display EMA, proceed to Indicators > Trend > Moving Average and select “Exponential” at “MA method” column.
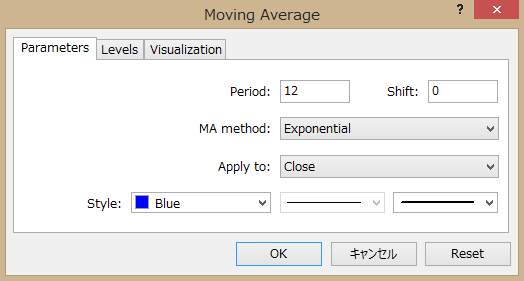
[NOTE] Indicators are available on the smartphone app.
Default Parameters of MACD
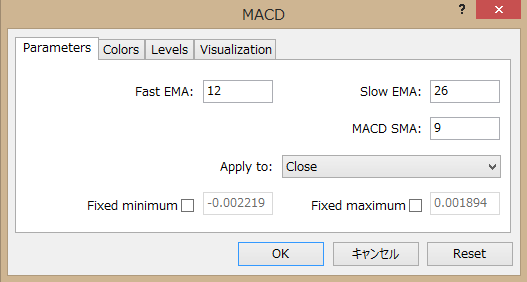
Fast EMA: 12
Slow EMA: 26
MACD SMA: 9
App to: Close
You can set these parameters at your discretion. But it is recommended to use the default parameters because you should follow the majority of other MACD users who prefer to use them.
How to Watch MACD
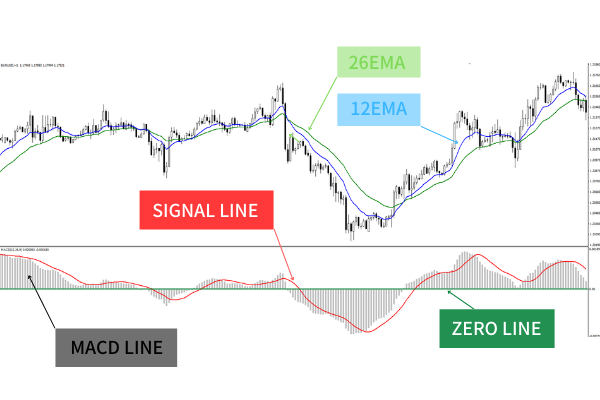
[NOTE] The above exposition-intended chart shows EMA 12 and EMA 26 to calculate MACD. EMAs cannot be automatically inserted when MACD is displayed. So insert EMAs as necessary.
Also, colors used in the MACD chart can be changed at the property menu, which can be displayed by pointing the cursor to MACD and doing right click.
MACD Line (gray)
MACD Line = Fast EMA (EMA 12) - Slow EMA (EMA 26)
MACD lines do the histogram calculation of the divergence range between two EMAs with different time windows.
Signal Line (red)
A signal line is a simple moving average (SMA) of MACD lines. In this case, the latest nine MACD lines are used.
You may be a little confused by hearing that MACD is calculated by EMA and signal line is calculated by SMA. You simply have to understand that MACD lines represent the divergence between fast and slow EMAs while a single line uses that divergence to calculate SMA.
Zero Line (green)
Zero line represents the level where the above-mentioned EMAs’ divergence becomes zero. On the below chart, when two EMAs get crossed, the divergence becomes zero.
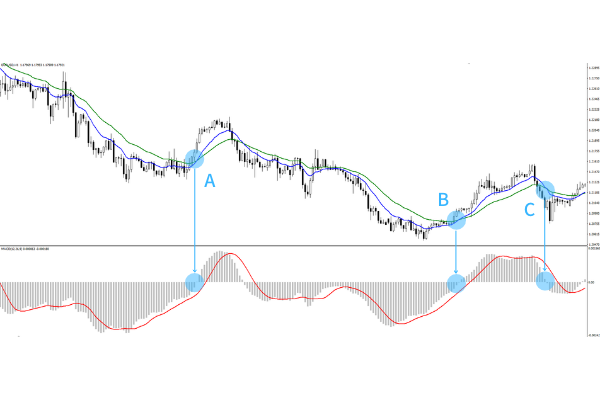
Many MACD users tend to consider the zero line as the signal of trend reversal because EMAs on the chart are displayed in a tilted fashion, which enshrouds their crossing.
How to Utilize MACD
Observe MACD Line and Signal Line
By observing the degree of tilt of MACD lines and a signal line, you can figure out the volatility of the market. Volatility represents the trading volume and is an important factor for market analysis.
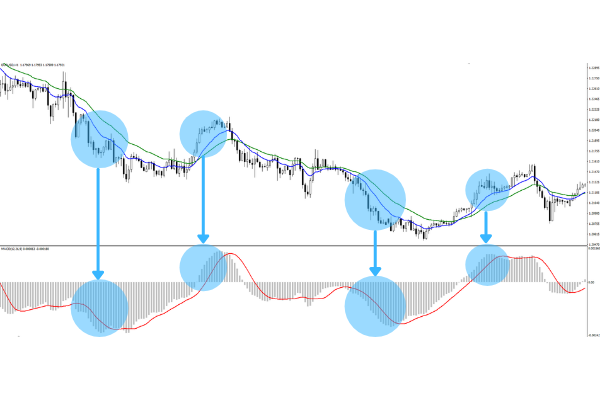
<Key Point>
・When both lines have steep angles, it is in the high volatile trading environment.
・When both lines have gentle angles, it is in the low volatile trading environment.
Although some traders have an ability to use the divergence of moving averages to figure out the volatility, MACD enables you to do it more easily.
Consider The Crossing of MACD And Signal Lines as Trend Reversal
The crossing of MACD lines and a signal line is similar to the golden cross and dead cross of moving average lines. When the MACD lines break above the signal line, it is equivalent to a golden cross. Meanwhile it is a dead cross in the opposite case.

The crucial difference is that the crossing of MACDs line and a signal line appears earlier than golden cross or dead cross. This is because MACD is calculated from the divergence range of EMAs and its SMA.
When a certain big trend occurs, EMAs show a steep tilt in line with the trend and widens the divergence. In this case, moving average lines are calculated from the prices of candlesticks during the specified period. So it takes time for the prices during the trend occurrence to be reflected to that calculation. These factors delay the crossing of moving average lines and reduction of divergence range.
Meanwhile, the formula to calculate MACD lines originally includes the divergence range. This means that MACD lines are not affected by past prices. It enables the crossing of MACD lines and a signal line to appear on the chart before the moving average lines get crossed.
<Crossing of Moving Average Lines>
This crossing does not appear only after the previous trend lost its momentum and a reversed trend occurs.
<Crossing of MACD>
This crossing appears when the current trend is losing its momentum.
In other words, the crossing of MACD lines and a signal line appears when the lasting momentum of hitting new highs plateaus amid the uptrend or conversely the one of hitting new lows becomes flattened amid the downtrend. Many traders utilize this responsiveness to decide the trend reversal for entry.
※ The inversion of MACD line’s histogram at zero line coincides with the crossing of EMAs.
Limitations of MACD and How to Solve Them
Limitations of MACD
MACD is not helpful in the environment of the sideways market where there is less volatility. This limitation weakens the accuracy to detect the sign of whether a trader should make an entry.
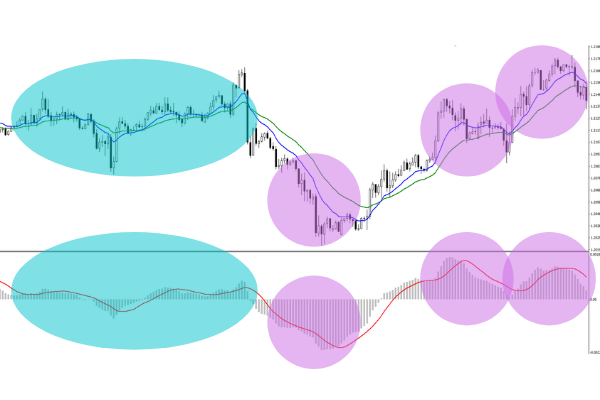
As shown above, MACD functions less in the sideways market environment (blue area on the above chart). A certain degree of volatility (purple areas) is required for MACD to become useful for clarifying the crossing of MACD line and signal line.
How to Solve Limitations
You should refrain from the entry when a certain degree of volatility is not expected.
There are some ways to cover the limitations such as using other indicators as a filter. But each indicator has its own strong and weak points. Meanwhile, MACD has a clear weak point that it functions little in the sideways market environment. By recognizing it, you can hedge the risks which may be caused by the unnecessary entry. You should wait for the occurrence of another trend and, even if you miss its first wave, wait for a correction and make an entry in anticipation of the next trend.
Conclusion
・MACD lines do the histogram calculation of the divergence range of two EMAs with different time windows.
・Signal line is a simple moving average line based on MACD.
・Zero line represents the level where the divergence between fast and slow EMAs becomes zero.
・You should observe the degree of tilt of MACD lines and a signal line. When they have steep angles, it is a high volatile trading environment, and when they have gentle angles, it is a low volatile trading environment.
・The crossing of MACD lines and a signal line appears on the chart before moving average lines get crossed.
・Many traders rely on MACD to determine the trend reversal for entry.
・MACD is not helpful in the sideways market environment.
・When a certain degree of volatility is not expected, you should refrain from making an entry on the basis of MACD.
Thank you very much for sparing your time to read this article.
